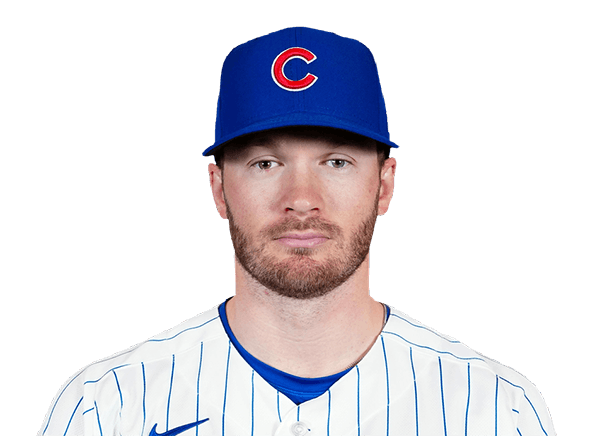
Ian Happ stats
CubsBio
- Age
- 32 yearsAug 12, 1994
- Height
- 5' 10"
- Weight
- 205 lbs
- NL Gold Glove
- 4x

Ian Happ recorded a .218 batting average, 24 home runs and 68 RBI in 156 games of 2026 for the Chicago Cubs. Last game: .
Stats
Standard
 Cubs
- GP
- 156
- AB
- 546
- R · 33rd
- 89
- H
- 119
- HR · 50th
- 24
- RBI
- 68
- SB
- 4
- AVG
- .218
Ranked among MLB players who qualify (AB, R, H, HR, RBI, SB: 40+ games; AVG: 300+ AB) that season; only the top 50 are shown. How each stat qualifies: glossary.
Career regular season
- GP
- 1,295
- AB
- 4,391
- R
- 656
- H
- 1,069
- HR
- 197
- RBI
- 625
- SB
- 74
- AVG
- .243
Career Postseason
- GP
- 18
- AB
- 51
- R
- 4
- H
- 8
- HR
- 3
- RBI
- 5
- SB
- 0
- AVG
- .157
Expanded
- PA
- 636
- TB
- 225
- XBH · 44th
- 55
- HBP
- 7
- IBB · 28th
- 4
- GIDP
- 11
- P/PA · 8th
- 4.29
Ranked among MLB players who qualify (PA: 100+ AB; TB, XBH, HBP, IBB: 300+ AB; P/PA: 300+ PA) that season; only the top 50 are shown. How each stat qualifies: glossary.
Career regular season
- PA
- 5,085
- TB
- 1,943
- XBH
- 461
- HBP
- 41
- IBB
- 28
- GIDP
- 81
- P/PA
- 4.12
Advanced
- WAR
- 2.9
- RC
- 75.3
- RC/27
- 4.60
- ISOP
- .194
- SECA · 36th
- .348
- BB/K
- 0.43
- AB/HR
- 22.8
- GO/FO
- 0.70
Ranked among MLB players with 300+ AB that season; only the top 50 are shown. How each stat qualifies: glossary.
Career regular season
- WAR
- 24.2
- RC
- 679.0
- RC/27
- 5.30
- ISOP
- .199
- SECA
- .351
- BB/K
- 0.46
- AB/HR
- 22.3
- GO/FO
- 0.70
Bio
- Age
- 32 yearsAug 12, 1994
- Height
- 5' 10"
- Weight
- 205 lbs
- Experience
- 10 yearsDebut 2017
- Birthplace
- Pittsburgh, PA
- Draft
- 2015Rd 1, Pk 9
- College
- Cincinnati
- NL Gold Glove
- 4x
Against other left fielders
2026 regular season, 64 MLB left fielders with 25+ games.
- Home Runs24
Higher than 92% of the other 63 MLB left fielders.
- Batting Average.218
Higher than 30% of the other 63 MLB left fielders.
- RBI68
Higher than 84% of the other 63 MLB left fielders.
Latest performance

Ian Happ
Sep 30 · @ SD · L 4-1
- AB
- 3
- R
- 0
- H
- 0
- HR
- 0
- RBI
- 0
- BB
- 1
- SO
- 1
- AVG
- .000
Games
All games| Date | Opponent | AB | R | H | HR | RBI |
|---|---|---|---|---|---|---|
| Wed, Sep 30 | at SDL 4-1 | 3 | 0 | 0 | 0 | 0 |
| Tue, Sep 29 | atSDL 8-0 | 3 | 0 | 0 | 0 | 0 |
| Sun, Sep 27 | at BOSW 6-2 | 5 | 0 | 0 | 0 | 0 |
| Fri, Sep 25 | atBOSL 4-3 | 0 | 0 | 0 | 0 | 0 |
| Fri, Sep 25 | atBOSL 2-0 | 4 | 0 | 0 | 0 | 0 |
| Thu, Sep 24 | vs MIAW 2-1 | 3 | 1 | 1 | 0 | 0 |
What are Ian Happ's career stats?
Ian Happ has played 10 seasons for the Cubs. He is a career .243 hitter with 1,069 hits, 197 home runs and 625 RBI. His best season so far is 2022: a .271 batting average, 17 home runs and 72 RBI.
Milestones within reach
- 3 more home runs for 200 — 197 now, 24 in his best season of the last two
Best single games
- Hits: 4 @ MIA on Jun 22, 2017, W 11-1
- Home Runs: 2 vs CIN on Aug 17, 2017, L 13-10
- RBI: 6 vs PHI on Jul 4, 2024, W 10-2
- Runs: 4 @ STL on Sep 26, 2017, L 8-7
- Stolen Bases: 2 vs CHW on Jul 25, 2017, W 7-2
- Walks: 3 @ CIN on May 20, 2018, W 6-1
Regular season only, from MLB game logs since 2017.
League leaderboards and awards
10 seasons, 5 postseasons, 2017 to 2026
Awards
- NL Gold Glove ×4: 2022, 2023, 2024, 2025
More on Ian Happ
Playoff series
Ian Happ played 18 games across 5 MLB postseasons in 7 series — 1 won, 6 lost.
| AB: At-bats: trips to the plate that ended in a hit, an out or an error. Walks and sacrifices are not counted. | H: Times the batter reached base by hitting the ball, without help from an error. | HR: Home runs hit. | RBI: Runs that scored because of this batter's plate appearance. | ||||
|---|---|---|---|---|---|---|---|
| 2026 | SD | Lost 0-2 | 2 | 6 | 0 | 0 | 0 |
| 2025 | SD | Won 2-1 | 3 | 11 | 1 | 0 | 0 |
| 2025 |  MIL | Lost 2-3 | 5 | 19 | 2 | 2 | 4 |
| 2020 | MIA | Lost 0-2 | 2 | 8 | 4 | 1 | 1 |
| 2018 |  COL | Lost 0-1 | 1 | 0 | 0 | 0 | 0 |
| 2017 |  WSH | Lost 0-2 | 2 | 3 | 0 | 0 | 0 |
| 2017 |  LAD | Lost 0-3 | 3 | 4 | 1 | 0 | 0 |
Ian Happ’s playoff series, round by round
Totals, from MLB game logs since the 2001 postseason — earlier series are not counted.
Ian Happ against each club
- vs Cincinnati Reds (141)
- vs St. Louis Cardinals (136)
- vs Milwaukee Brewers (135)
- vs Pittsburgh Pirates (134)
- vs San Diego Padres (59)
- vs Washington Nationals (57)
- vs New York Mets (51)
- vs Arizona Diamondbacks (50)
- vs San Francisco Giants (50)
- vs Philadelphia Phillies (49)
- vs Colorado Rockies (47)
- vs Atlanta Braves (46)
- vs Los Angeles Dodgers (46)
- vs Miami Marlins (43)
- vs Chicago White Sox (39)
- vs Kansas City Royals (22)
- vs Minnesota Twins (22)
- vs Cleveland Guardians (21)
- vs Detroit Tigers (20)
- vs Baltimore Orioles (19)
- vs Toronto Blue Jays (18)
- vs Tampa Bay Rays (16)
- vs Athletics (15)
- vs Boston Red Sox (15)
- vs New York Yankees (14)
- vs Seattle Mariners (14)
- vs Los Angeles Angels (12)
- vs Texas Rangers (12)
- vs Houston Astros (10)
Similar players
Closest career per-game profiles to Ian Happ among MLB players at the same position.
- Michael BuschCHCAlike in RBI, Slugging %, On-Base %79out of 100 on profile similarity
- Domingo SantanaAlike in On-Base %, Slugging %, Home Runs79out of 100 on profile similarity
- Michael ConfortoCHCAlike in On-Base %, Home Runs, Slugging %79out of 100 on profile similarity
- Carlos SantanaAlike in Home Runs, Runs, RBI77out of 100 on profile similarity
- Wilyer AbreuBOSAlike in Home Runs, RBI, Slugging %76out of 100 on profile similarity


Compare Ian Happ with Michael Busch, Domingo Santana, Michael Conforto