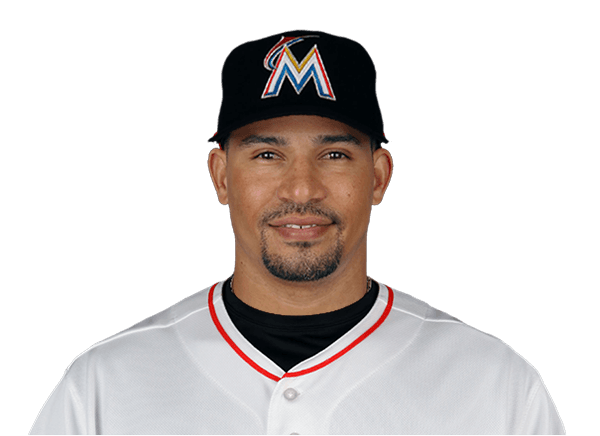
Rafael Furcal stats
Bio
- Age
- 49 yearsOct 24, 1977
- Height
- 5' 8"
- NL Rookie of the Year
- 2000
Rafael Furcal played 14 MLB seasons, 2000 to 2014.
Stats
Standard
Career regular season
- GP
- 1,614
- AB
- 6,477
- R
- 1,063
- H
- 1,817
- HR
- 113
- RBI
- 587
- SB
- 314
- AVG
- .281
Ranked among MLB players who qualify (AB, R, H, HR, RBI, SB: 40+ games; AVG: 300+ AB) that season; only the top 50 are shown. How each stat qualifies: glossary.
| GP: Games the player appeared in, however briefly. | AB: At-bats: trips to the plate that ended in a hit, an out or an error. Walks and sacrifices are not counted. | R: Runs — scored by the batter, or allowed by the pitcher. | H: Times the batter reached base by hitting the ball, without help from an error. | HR: Home runs hit. | RBI: Runs that scored because of this batter's plate appearance. | SB: Bases taken while the pitcher was delivering. Being caught is counted separately. | AVG: Hits per at-bat. .300 is the traditional line between a good hitter and a great one. | ||
|---|---|---|---|---|---|---|---|---|---|
| 2000 | ATL | 131 | 455 | 87 | 134 | 4 | 37 | 40 | .295 |
| 2001 | ATL | 79 | 324 | 39 | 89 | 4 | 30 | 22 | .275 |
| 2002 | ATL | 154 | 636 | 95 | 175 | 8 | 47 | 27 | .275 |
| 2003 | ATL | 156 | 664 | 130 | 194 | 15 | 61 | 25 | .292 |
| 2004 | ATL | 143 | 563 | 103 | 157 | 14 | 59 | 29 | .279 |
| 2005 | ATL | 154 | 616 | 100 | 175 | 12 | 58 | 46 | .284 |
| 2006 | LAD | 159 | 654 | 113 | 196 | 15 | 63 | 37 | .300 |
| 2007 | LAD | 138 | 581 | 87 | 157 | 6 | 47 | 25 | .270 |
| 2008 | LAD | 36 | 143 | 34 | 51 | 5 | 16 | 8 | .357 |
| 2009 | LAD | 150 | 613 | 92 | 165 | 9 | 47 | 12 | .269 |
| 2010 | LAD | 97 | 383 | 66 | 115 | 8 | 43 | 22 | .300 |
| 2011 |  LAD/STL | 87 | 333 | 44 | 77 | 8 | 28 | 9 | .231 |
| 2012 | STL | 121 | 477 | 69 | 126 | 5 | 49 | 12 | .264 |
| 2014 | MIA | 9 | 35 | 4 | 6 | 0 | 2 | 0 | .171 |
Career Postseason
- GP
- 59
- AB
- 247
- R
- 33
- H
- 56
- HR
- 4
- RBI
- 16
- SB
- 13
- AVG
- .227
Expanded
Career regular season
- PA
- 7,237
- TB
- 2,605
- XBH
- 493
- HBP
- 22
- IBB
- 24
- GIDP
- 84
- P/PA
- 3.36
Ranked among MLB players who qualify (PA: 100+ AB; TB, XBH, HBP, IBB: 300+ AB; P/PA: 300+ PA) that season; only the top 50 are shown. How each stat qualifies: glossary.
| PA: Plate appearances — every trip to the plate, walks and sacrifices included. | TB: Total bases — one for a single, four for a home run. | XBH: Extra-base hits: doubles, triples and home runs. | HBP: Times the batter was hit by a pitch and took first base. | IBB: Walks the other team issued on purpose. | GIDP: Times the batter grounded into a double play — lower is better. | P/PA: Pitches the batter saw per trip to the plate. Above 4.0 is a patient hitter. | ||
|---|---|---|---|---|---|---|---|---|
| 2000 | ATL | 542 | 174 | 28 | 3 | 0 | 2 | 0 |
| 2001 | ATL | 359 | 120 | 23 | 1 | 1 | 5 | 0 |
| 2002 | ATL | 693 | 246 | 47 | 3 | 0 | 8 | 3.8 |
| 2003 | ATL | 734 | 294 | 60 | 3 | 2 | 1 | 3.9 |
| 2004 | ATL | 632 | 233 | 43 | 1 | 4 | 9 | 4.0 |
| 2005 | ATL | 689 | 264 | 54 | 1 | 3 | 11 | 3.8 |
| 2006 | LAD | 736 | 291 | 56 | 1 | 3 | 7 | 3.8 |
| 2007 | LAD | 643 | 206 | 33 | 1 | 3 | 11 | 3.7 |
| 2008 | LAD | 164 | 82 | 19 | 1 | 0 | 3 | 4.0 |
| 2009 | LAD | 680 | 230 | 42 | 1 | 2 | 11 | 3.9 |
| 2010 | LAD | 428 | 176 | 38 | 1 | 5 | 5 | 4.0 |
| 2011 | LAD/STL | 369 | 116 | 23 | 4 | 0 | 3 | 3.7 |
| 2012 | STL | 531 | 165 | 26 | 1 | 1 | 7 | 3.8 |
| 2014 | MIA | 37 | 8 | 1 | 0 | 0 | 1 | 4.1 |
What the columns mean: PA · TB · XBH · HBP · IBB · GIDP · P/PA
Advanced
Career regular season
- WAR
- 37.4
- RC
- 951.0
- RC/27
- 5.20
- ISOP
- .122
- SECA
- .255
- BB/K
- 0.71
- AB/HR
- 57.3
- GO/FO
- 1.10
Ranked among MLB players with 300+ AB that season; only the top 50 are shown. How each stat qualifies: glossary.
| WAR: Wins above replacement — wins the player added over a freely available fill-in. | RC: Runs created — an estimate of how many runs the batter's hitting produced. | RC/27: Runs a lineup of this batter would score in a full game of 27 outs. | ISOP: Isolated power: slugging minus batting average, so only extra bases count. | SECA: Secondary average: bases from walks, steals and extra-base hits, per at-bat. | BB/K: Walks for every strikeout, a measure of plate discipline. | AB/HR: At-bats per home run — lower means more power. | GO/FO: Ground-ball outs for every fly-ball out. | ||
|---|---|---|---|---|---|---|---|---|---|
| 2000 | ATL | 3.8 | 78.7 | 6.1 | .088 | 0.3 | 0.9 | 113.8 | 0 |
| 2001 | ATL | 0.1 | 41.5 | 4.4 | .096 | 0.2 | 0.4 | 81 | 0 |
| 2002 | ATL | 2.6 | 79.6 | 4.3 | .112 | 0.2 | 0.4 | 79.5 | 0 |
| 2003 | ATL | 4.9 | 111.3 | 6.3 | .151 | 0.3 | 0.8 | 44.3 | 0 |
| 2004 | ATL | 3.1 | 85.4 | 5.3 | .135 | 0.3 | 0.8 | 40.2 | 1.1 |
| 2005 | ATL | 6.3 | 97.8 | 5.6 | .144 | 0.3 | 0.8 | 51.3 | 1 |
| 2006 | LAD | 4.2 | 111.8 | 6.2 | .145 | 0.3 | 0.7 | 43.6 | 1.1 |
| 2007 | LAD | 1.7 | 72.4 | 4.4 | .084 | 0.2 | 0.8 | 96.8 | 1.1 |
| 2008 | LAD | 2.0 | 34.3 | 9.4 | .217 | 0.4 | 1.2 | 28.6 | 1 |
| 2009 | LAD | 3.2 | 78.4 | 4.5 | .106 | 0.2 | 0.7 | 68.1 | 1.3 |
| 2010 | LAD | 4.1 | 67.5 | 6.5 | .159 | 0.3 | 0.7 | 47.9 | 1 |
| 2011 | LAD/STL | 0.4 | 35.7 | 3.6 | .117 | 0.2 | 0.7 | 41.6 | 1.3 |
| 2012 | STL | 1.2 | 56.5 | 4.1 | .082 | 0.2 | 0.8 | 95.4 | 1.3 |
| 2014 | MIA | -0.2 | 1 | 0.9 | .057 | 0.1 | 0.3 | 0 | 3.7 |
What the columns mean: WAR · RC · RC/27 · ISOP · SECA · BB/K · AB/HR · GO/FO
Bio
- Age
- 49 yearsOct 24, 1977
- Height
- 5' 8"
- Debut
- 2000
- Birthplace
- Loma de Cabrera, Dominican Republic
- NL Rookie of the Year
- 2000
Latest performance

Rafael Furcal
Jun 21 · vs NYM · L 4-0
- AB
- 2
- R
- 0
- H
- 0
- HR
- 0
- RBI
- 0
- BB
- 0
- SO
- 0
- AVG
- .171
Games
All games| Date | Opponent | AB | R | H | HR | RBI |
|---|---|---|---|---|---|---|
| Sat, Jun 21 | vs NYML 4-0 | 2 | 0 | 0 | 0 | 0 |
| Fri, Jun 20 | vsNYMW 3-2 | 4 | 1 | 1 | 0 | 0 |
| Thu, Jun 19 | vsNYML 1-0 | 4 | 0 | 0 | 0 | 0 |
| Wed, Jun 18 | vs CHCL 6-1 | 3 | 0 | 0 | 0 | 0 |
| Tue, Jun 17 | vsCHCW 6-5 | 5 | 1 | 2 | 0 | 2 |
| Mon, Jun 16 | vsCHCL 5-4 F/13 | 1 | 0 | 0 | 0 | 0 |
What were Rafael Furcal's career stats?
Rafael Furcal played 14 seasons for the Braves, the Dodgers, the Cardinals and the Marlins. He was a career .281 hitter with 1,817 hits, 113 home runs and 587 RBI. His best season was 2008: a .357 batting average, 5 home runs and 16 RBI.
League leaderboards and awards
14 seasons, 8 postseasons, 2000 to 2014
Rafael Furcal finished top 10 in a stat 3 times.
Championships
- 2011 World Series with the St. Louis Cardinals
Awards
All-time career rank
- 158th in stolen bases (314)
Among the 10,544 MLB players with a career line on file, regular season. A place deeper than 300th is not listed.
Season top 10 finishes
- Hits: 2006 (10th)
- Stolen Bases: 2000 (6th), 2005 (5th)
Among qualified MLB players each season, as the glossary defines each stat. All-time places are among players on file.
More on Rafael Furcal
Playoff series
Rafael Furcal played 56 games across 8 MLB postseasons in 12 series — 5 won, 7 lost.
| AB: At-bats: trips to the plate that ended in a hit, an out or an error. Walks and sacrifices are not counted. | H: Times the batter reached base by hitting the ball, without help from an error. | HR: Home runs hit. | RBI: Runs that scored because of this batter's plate appearance. | ||||
|---|---|---|---|---|---|---|---|
| 2011 |  PHI | Won 3-2 | 5 | 22 | 5 | 0 | 1 |
| 2011 |  MIL | Won 4-2 | 6 | 27 | 5 | 1 | 1 |
| 2011 |  TEX | Won 4-3 | 7 | 28 | 5 | 0 | 1 |
| 2009 | STL | Won 3-0 | 3 | 12 | 6 | 0 | 2 |
| 2009 | PHI | Lost 1-4 | 5 | 21 | 3 | 0 | 1 |
| 2008 | CHC | Won 3-0 | 3 | 12 | 4 | 0 | 2 |
| 2008 | PHI | Lost 1-4 | 5 | 19 | 4 | 1 | 1 |
| 2006 | NYM | Lost 0-3 | 3 | 11 | 2 | 0 | 1 |
| 2005 |  HOU | Lost 1-3 | 4 | 20 | 3 | 0 | 0 |
| 2004 | HOU | Lost 2-3 | 5 | 21 | 8 | 2 | 4 |
| 2003 | CHC | Lost 2-3 | 5 | 19 | 4 | 0 | 0 |
| 2002 |  SF | Lost 2-3 | 5 | 24 | 6 | 0 | 2 |
Rafael Furcal’s playoff series, round by round
Totals, from MLB game logs since the 2001 postseason — earlier series are not counted.
Rafael Furcal against each club
- vs Philadelphia Phillies (128)
- vs New York Mets (126)
- vs Miami Marlins (116)
- vs San Francisco Giants (114)
- vs San Diego Padres (105)
- vs Arizona Diamondbacks (101)
- vs Washington Nationals (98)
- vs Colorado Rockies (93)
- vs Pittsburgh Pirates (89)
- vs Chicago Cubs (76)
- vs Cincinnati Reds (70)
- vs Milwaukee Brewers (69)
- vs Houston Astros (68)
- vs St. Louis Cardinals (56)
- vs Los Angeles Dodgers (38)
- vs Atlanta Braves (36)
- vs Los Angeles Angels (27)
- vs Texas Rangers (17)
- vs Boston Red Sox (14)
- vs Chicago White Sox (13)
- vs Athletics (11)
- vs Detroit Tigers (9)
- vs Kansas City Royals (9)
- vs Seattle Mariners (9)
- vs Toronto Blue Jays (9)
- vs Baltimore Orioles (8)
- vs Cleveland Guardians (6)
- vs Minnesota Twins (6)
- vs New York Yankees (6)
- vs Tampa Bay Rays (6)
Similar players
Closest career per-game profiles to Rafael Furcal among MLB players at the same position.
- Brian RobertsAlike in On-Base %, Stolen Bases, Batting Average81out of 100 on profile similarity
- Shane VictorinoAlike in Stolen Bases, On-Base %, Batting Average68out of 100 on profile similarity
- Johnny DamonAlike in Runs, Batting Average, On-Base %66out of 100 on profile similarity
- Lorenzo CainAlike in Batting Average, On-Base %, Stolen Bases65out of 100 on profile similarity
- Denard SpanAlike in Batting Average, On-Base %63out of 100 on profile similarity


Compare Rafael Furcal with Brian Roberts, Shane Victorino, Johnny Damon