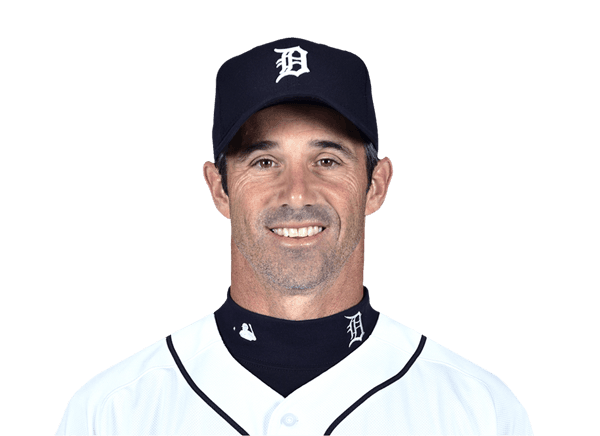
Brad Ausmus stats
Bio
- Age
- 57 yearsApr 14, 1969
- Height
- 5' 11"
- NL Gold Glove
- 3x
Brad Ausmus played 18 MLB seasons, 1993 to 2010.
Stats
Standard
Career regular season
- GP
- 1,971
- AB
- 6,279
- R
- 718
- H
- 1,579
- HR
- 80
- RBI
- 607
- SB
- 102
- AVG
- .251
| GP: Games the player appeared in, however briefly. | AB: At-bats: trips to the plate that ended in a hit, an out or an error. Walks and sacrifices are not counted. | R: Runs — scored by the batter, or allowed by the pitcher. | H: Times the batter reached base by hitting the ball, without help from an error. | HR: Home runs hit. | RBI: Runs that scored because of this batter's plate appearance. | SB: Bases taken while the pitcher was delivering. Being caught is counted separately. | AVG: Hits per at-bat. .300 is the traditional line between a good hitter and a great one. | ||
|---|---|---|---|---|---|---|---|---|---|
| 1993 | SD | 49 | 160 | 18 | 41 | 5 | 12 | 2 | .256 |
| 1994 | SD | 101 | 327 | 45 | 82 | 7 | 24 | 5 | .251 |
| 1995 | SD | 103 | 328 | 44 | 96 | 5 | 34 | 16 | .293 |
| 1996 |  SD/DET | 125 | 375 | 46 | 83 | 5 | 35 | 4 | .221 |
| 1997 | HOU | 130 | 425 | 45 | 113 | 4 | 44 | 14 | .266 |
| 1998 | HOU | 128 | 412 | 62 | 111 | 6 | 45 | 10 | .269 |
| 1999 | DET | 127 | 458 | 62 | 126 | 9 | 54 | 12 | .275 |
| 2000 | DET | 150 | 523 | 75 | 139 | 7 | 51 | 11 | .266 |
| 2001 | HOU | 128 | 422 | 45 | 98 | 5 | 34 | 4 | .232 |
| 2002 | HOU | 130 | 447 | 57 | 115 | 6 | 50 | 2 | .257 |
| 2003 | HOU | 143 | 450 | 43 | 103 | 4 | 47 | 5 | .229 |
| 2004 | HOU | 129 | 403 | 38 | 100 | 5 | 31 | 2 | .248 |
| 2005 | HOU | 134 | 387 | 35 | 100 | 3 | 47 | 5 | .258 |
| 2006 | HOU | 139 | 439 | 37 | 101 | 2 | 39 | 3 | .230 |
| 2007 | HOU | 117 | 349 | 38 | 82 | 3 | 25 | 6 | .235 |
| 2008 | HOU | 81 | 216 | 15 | 47 | 3 | 24 | 0 | .218 |
| 2009 | LAD | 36 | 95 | 9 | 28 | 1 | 9 | 1 | .295 |
| 2010 | LAD | 21 | 63 | 4 | 14 | 0 | 2 | 0 | .222 |
Career Postseason
- GP
- 35
- AB
- 106
- R
- 12
- H
- 26
- HR
- 3
- RBI
- 7
- SB
- 1
- AVG
- .245
Expanded
Career regular season
- PA
- 7,102
- TB
- 2,157
- XBH
- 384
- HBP
- 69
- IBB
- 69
- GIDP
- 201
- P/PA
- 1.65
Ranked among MLB players who qualify (PA: 100+ AB; TB, XBH, HBP, IBB: 300+ AB; P/PA: 300+ PA) that season; only the top 50 are shown. How each stat qualifies: glossary.
| PA: Plate appearances — every trip to the plate, walks and sacrifices included. | TB: Total bases — one for a single, four for a home run. | XBH: Extra-base hits: doubles, triples and home runs. | HBP: Times the batter was hit by a pitch and took first base. | IBB: Walks the other team issued on purpose. | GIDP: Times the batter grounded into a double play — lower is better. | P/PA: Pitches the batter saw per trip to the plate. Above 4.0 is a patient hitter. | ||
|---|---|---|---|---|---|---|---|---|
| 1993 | SD | 167 | 66 | 14 | 0 | 0 | 2 | 0 |
| 1994 | SD | 366 | 117 | 20 | 1 | 12 | 8 | 0 |
| 1995 | SD | 369 | 135 | 25 | 2 | 3 | 6 | 0 |
| 1996 | SD/DET | 427 | 114 | 21 | 5 | 1 | 8 | 0 |
| 1997 | HOU | 478 | 152 | 30 | 3 | 4 | 8 | 0 |
| 1998 | HOU | 472 | 147 | 20 | 3 | 11 | 18 | 0 |
| 1999 | DET | 527 | 190 | 40 | 14 | 0 | 11 | 0 |
| 2000 | DET | 604 | 191 | 35 | 6 | 0 | 19 | 0 |
| 2001 | HOU | 461 | 144 | 32 | 1 | 6 | 13 | 0 |
| 2002 | HOU | 496 | 158 | 28 | 6 | 3 | 30 | 3.6 |
| 2003 | HOU | 509 | 131 | 18 | 4 | 1 | 8 | 3.6 |
| 2004 | HOU | 448 | 131 | 20 | 2 | 11 | 13 | 3.3 |
| 2005 | HOU | 451 | 128 | 22 | 5 | 8 | 17 | 3.7 |
| 2006 | HOU | 502 | 125 | 19 | 6 | 2 | 21 | 3.6 |
| 2007 | HOU | 397 | 113 | 22 | 6 | 3 | 11 | 3.7 |
| 2008 | HOU | 250 | 64 | 11 | 2 | 3 | 4 | 3.9 |
| 2009 | LAD | 107 | 35 | 5 | 2 | 0 | 1 | 3.9 |
| 2010 | LAD | 71 | 16 | 2 | 1 | 1 | 3 | 4.2 |
What the columns mean: PA · TB · XBH · HBP · IBB · GIDP · P/PA
Advanced
Career regular season
- WAR
- 13.7
- RC
- 693.1
- RC/27
- 3.70
- ISOP
- .092
- SECA
- .201
- BB/K
- 0.61
- AB/HR
- 78.5
- GO/FO
- 1.10
Ranked among MLB players with 300+ AB that season; only the top 50 are shown. How each stat qualifies: glossary.
| WAR: Wins above replacement — wins the player added over a freely available fill-in. | RC: Runs created — an estimate of how many runs the batter's hitting produced. | RC/27: Runs a lineup of this batter would score in a full game of 27 outs. | ISOP: Isolated power: slugging minus batting average, so only extra bases count. | SECA: Secondary average: bases from walks, steals and extra-base hits, per at-bat. | BB/K: Walks for every strikeout, a measure of plate discipline. | AB/HR: At-bats per home run — lower means more power. | GO/FO: Ground-ball outs for every fly-ball out. | ||
|---|---|---|---|---|---|---|---|---|---|
| 1993 | SD | 0.5 | 18.6 | 4.1 | .156 | 0.2 | 0.2 | 32 | 0 |
| 1994 | SD | 0.3 | 37 | 3.8 | .107 | 0.2 | 0.5 | 46.7 | 0 |
| 1995 | SD | 2.9 | 49.7 | 5.3 | .119 | 0.2 | 0.6 | 65.6 | 0 |
| 1996 | SD/DET | 0.3 | 32.7 | 2.8 | .083 | 0.2 | 0.5 | 75 | 0 |
| 1997 | HOU | 2.1 | 51.4 | 4.1 | .092 | 0.2 | 0.5 | 106.3 | 0 |
| 1998 | HOU | 1.6 | 52.1 | 4.3 | .087 | 0.2 | 0.9 | 68.7 | 0 |
| 1999 | DET | 3.1 | 69.3 | 5.3 | .140 | 0.3 | 0.7 | 50.9 | 0 |
| 2000 | DET | 3.0 | 68.8 | 4.5 | .099 | 0.2 | 0.9 | 74.7 | 0 |
| 2001 | HOU | -0.1 | 38.4 | 3 | .109 | 0.2 | 0.5 | 84.4 | 0 |
| 2002 | HOU | 0.5 | 42.9 | 3.1 | .096 | 0.2 | 0.5 | 74.5 | 0 |
| 2003 | HOU | 0.2 | 41.1 | 3 | .062 | 0.2 | 0.7 | 112.5 | 0 |
| 2004 | HOU | -0.3 | 38.2 | 3.1 | .077 | 0.2 | 0.6 | 80.6 | 1.1 |
| 2005 | HOU | 0.5 | 44.8 | 3.8 | .072 | 0.2 | 1.1 | 129 | 1.2 |
| 2006 | HOU | -0.4 | 35.8 | 2.6 | .055 | 0.2 | 0.6 | 219.5 | 1.2 |
| 2007 | HOU | -0.4 | 36.3 | 3.4 | .089 | 0.2 | 0.5 | 116.3 | 1.1 |
| 2008 | HOU | -0.3 | 19.5 | 2.9 | .079 | 0.2 | 0.6 | 72 | 0.9 |
| 2009 | LAD | 0.3 | 12.6 | 4.6 | .074 | 0.1 | 0.2 | 95 | 0.8 |
| 2010 | LAD | -0.1 | 4.5 | 2.3 | .032 | 0.1 | 0.5 | 0 | 1.1 |
What the columns mean: WAR · RC · RC/27 · ISOP · SECA · BB/K · AB/HR · GO/FO
Bio
- Age
- 57 yearsApr 14, 1969
- Height
- 5' 11"
- Debut
- 1993
- Birthplace
- New Haven, CT
- Draft
- 1987Rd 48, Pk 1
- College
- Dartmouth
- NL Gold Glove
- 3x
Latest performance

Brad Ausmus
Oct 03 · vs ARI · W 3-1
- AB
- 4
- R
- 0
- H
- 2
- HR
- 0
- RBI
- 0
- BB
- 0
- SO
- 0
- AVG
- .222
Games
All games| Date | Opponent | AB | R | H | HR | RBI |
|---|---|---|---|---|---|---|
| Sun, Oct 03 | vs ARIW 3-1 | 4 | 0 | 2 | 0 | 0 |
| Sun, Sep 19 | vs COLW 7-6 F/11 | 0 | 0 | 0 | 0 | 0 |
| Sun, Sep 12 | at HOUL 7-4 | 4 | 0 | 0 | 0 | 0 |
| Mon, Sep 06 | at SDL 4-2 | 2 | 0 | 0 | 0 | 0 |
| Sun, Aug 29 | atCOLL 10-5 | 3 | 1 | 0 | 0 | 0 |
| Thu, Aug 26 | at MILW 7-1 | 4 | 1 | 3 | 0 | 0 |
What were Brad Ausmus's career stats?
Brad Ausmus played 18 seasons for the Padres, the Astros, the Tigers and the Dodgers. He was a career .251 hitter with 1,579 hits, 80 home runs and 607 RBI. His best season was 2009: a .295 batting average, 1 home run and 9 RBI.
League leaderboards and awards
18 seasons, 4 postseasons, 1993 to 2010
Awards
- NL Gold Glove ×3: 2001, 2002, 2006
More on Brad Ausmus
Playoff series
Brad Ausmus played 28 games across 3 MLB postseasons in 6 series — 3 won, 3 lost.
| AB: At-bats: trips to the plate that ended in a hit, an out or an error. Walks and sacrifices are not counted. | H: Times the batter reached base by hitting the ball, without help from an error. | HR: Home runs hit. | RBI: Runs that scored because of this batter's plate appearance. | ||||
|---|---|---|---|---|---|---|---|
| 2005 |  ATL | Won 2-1 | 3 | 12 | 2 | 0 | 0 |
| 2005 |  STL | Won 4-2 | 6 | 22 | 7 | 0 | 1 |
| 2005 |  CHW | Lost 0-4 | 4 | 16 | 4 | 0 | 0 |
| 2004 | ATL | Won 3-2 | 5 | 9 | 3 | 1 | 1 |
| 2004 | STL | Lost 3-4 | 7 | 19 | 2 | 0 | 0 |
| 2001 | ATL | Lost 0-3 | 3 | 8 | 2 | 1 | 2 |
Brad Ausmus’s playoff series, round by round
Totals, from MLB game logs since the 2001 postseason — earlier series are not counted.
Brad Ausmus against each club
- vs St. Louis Cardinals (123)
- vs Pittsburgh Pirates (113)
- vs Milwaukee Brewers (103)
- vs Cincinnati Reds (102)
- vs Chicago Cubs (99)
- vs Atlanta Braves (52)
- vs Colorado Rockies (46)
- vs San Diego Padres (45)
- vs Arizona Diamondbacks (44)
- vs New York Mets (44)
- vs San Francisco Giants (42)
- vs Philadelphia Phillies (41)
- vs Washington Nationals (41)
- vs Los Angeles Dodgers (40)
- vs Miami Marlins (39)
- vs Texas Rangers (33)
- vs Chicago White Sox (10)
- vs Seattle Mariners (10)
- vs Baltimore Orioles (7)
- vs Kansas City Royals (6)
- vs New York Yankees (6)
- vs Los Angeles Angels (5)
- vs Minnesota Twins (5)
- vs Tampa Bay Rays (5)
- vs Boston Red Sox (4)
- vs Toronto Blue Jays (3)
- vs Athletics (2)
- vs Detroit Tigers (2)
- vs Houston Astros (2)
- vs Cleveland Guardians (1)
Similar players
Closest career per-game profiles to Brad Ausmus among MLB players at the same position.
- Spike OwenAlike in Slugging %, Stolen Bases87out of 100 on profile similarity
- Kurt StillwellAlike in Runs, RBI84out of 100 on profile similarity
- Kevin StockerAlike in Slugging %, Stolen Bases81out of 100 on profile similarity
- Ramon VazquezAlike in Batting Average, On-Base %81out of 100 on profile similarity
- Mitch MaierAlike in Slugging %, On-Base %81out of 100 on profile similarity


Compare Brad Ausmus with Spike Owen, Kurt Stillwell, Kevin Stocker