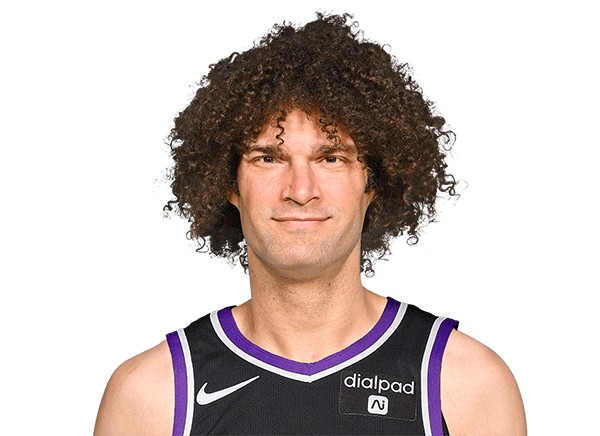
Robin Lopez stats

Last played for the Milwaukee Bucks, 2023-24

Center · #42

Age 38 · 7' 1"

Compare with…

Robin Lopez played 16 NBA seasons, 2008-09 to 2023-24.

Stats

Choose how these numbers are shown

Per game

Career regular season

PTS
8.4
REB
4.7
AST
0.8
STL
0.2
BLK
1.1
TS%
57.4
MIN
21.1
GP
992

Ranked among NBA players who qualify (PTS, REB, AST, STL, BLK: 20+ games; TS%: 20+ games, 5+ FGA) that season; only the top 50 are shown. How each stat qualifies: glossary.

Per game by season
PTS: Points scored — a free throw is worth 1, a shot inside the arc 2, beyond it 3.REB: Missed shots the player collected, at either end of the floor.AST: Passes that led directly to a team-mate's basket.STL: Possessions taken off the opponent by picking off a pass or a dribble.BLK: Opponent shots swatted away before they reached the rim.TS%: Scoring per shot with threes and free throws counted: PTS ÷ (2 × (FGA + 0.44 × FTA)). League average sits near 58%.MIN: Minutes on the floor.GP: Games the player appeared in, however briefly.
2008-09PHX3.22.00.10.20.756.610.260
2009-10PHX8.44.90.10.21.062.119.351
2010-11PHX6.43.20.10.30.753.914.867
2011-12PHX5.43.30.30.30.952.614.064
2012-13NO11.35.60.80.41.657.326.082
2013-14POR11.18.50.90.31.760.531.882
2014-15POR9.66.70.90.31.457.427.859
2015-16NY10.37.31.40.21.657.427.182
2016-17CHI10.46.41.00.21.451.128.081
2017-18CHI11.84.51.90.20.855.226.464
2018-19CHI9.53.91.20.11.159.821.774
2019-20MIL5.42.40.70.20.755.414.566
2020-21WSH9.03.80.80.20.666.119.171
2021-22ORL7.13.51.50.10.557.017.036
2022-23CLE3.01.40.50.10.267.58.137
2023-24MIL1.10.30.30.10.245.34.116

What the columns mean: PTS · REB · AST · STL · BLK · TS% · MIN · GP

Career Postseason

PTS
8.2
REB
5.4
AST
0.4
STL
0.3
BLK
0.9
TS%
61.6
MIN
22.4
GP
38

Totals

Career regular season

PTS
8,326
REB
4,659
AST
819
STL
219
BLK
1,045
TO
1,063
FGM
3,484
3PTM
57
Totals by season
PTS: Points scored — a free throw is worth 1, a shot inside the arc 2, beyond it 3.REB: Missed shots the player collected, at either end of the floor.AST: Passes that led directly to a team-mate's basket.STL: Possessions taken off the opponent by picking off a pass or a dribble.BLK: Opponent shots swatted away before they reached the rim.TO: Possessions handed to the opponent by a bad pass, a lost dribble or an offensive foul — lower is better.FGM: Shots made from the floor — everything except free throws.3PTM: Three-point shots made.
2008-09PHX1891188114128710
2009-10PHX43024871053411710
2010-11PHX43221681845481790
2011-12PHX348209201860431240
2012-13NO92946264321281103840
2013-14POR9086997325139843550
2014-15POR566394551684732340
2015-16NY842602114161291333570
2016-17CHI8395208018117913820
2017-18CHI75629012414531073424
2018-19CHI704286891178963047
2019-20MIL3571614510456314735
2020-21WSH642272551544752695
2021-22ORL25412654218441102
2022-23CLE11251192825482
2023-24MIL185413272

What the columns mean: PTS · REB · AST · STL · BLK · TO · FGM · 3PTM

Per 36 min

Career regular season

PTS
14.3
REB
8.0
AST
1.4
STL
0.3
BLK
1.9
TS%
57.4
MIN
21.1
GP
992

Per 36 minutes: each per-game figure scaled by 36 ÷ minutes played. Derived here, and shooting percentages are left untouched because they do not scale.

Per 36 min by season
PTS: Points scored — a free throw is worth 1, a shot inside the arc 2, beyond it 3.REB: Missed shots the player collected, at either end of the floor.AST: Passes that led directly to a team-mate's basket.STL: Possessions taken off the opponent by picking off a pass or a dribble.BLK: Opponent shots swatted away before they reached the rim.TS%: Scoring per shot with threes and free throws counted: PTS ÷ (2 × (FGA + 0.44 × FTA)). League average sits near 58%.MIN: Minutes on the floor.GP: Games the player appeared in, however briefly.
2008-09PHX11.37.10.40.72.556.610.260
2009-10PHX15.79.10.20.41.962.119.351
2010-11PHX15.67.80.20.71.753.914.867
2011-12PHX13.98.50.80.82.352.614.064
2012-13NO15.67.81.10.62.257.326.082
2013-14POR12.69.61.00.31.960.531.882
2014-15POR12.48.71.20.41.857.427.859
2015-16NY13.79.71.90.32.157.427.182
2016-17CHI13.48.21.30.31.851.128.081
2017-18CHI16.16.12.60.31.155.226.464
2018-19CHI15.86.52.00.21.859.821.774
2019-20MIL13.46.01.70.51.755.414.566
2020-21WSH17.07.21.50.41.166.119.171
2021-22ORL15.07.43.20.21.157.017.036
2022-23CLE13.36.22.20.40.967.58.137
2023-24MIL9.72.62.60.91.845.34.116

What the columns mean: PTS · REB · AST · STL · BLK · TS% · MIN · GP

Fantasy

Career regular season

GP
992
ESPN
17,640.0
YAHOO
17,874.3
ESPN/G
17.8
YAHOO/G
18.0

Fantasy points in ESPN’s and Yahoo’s default points leagues, worked out here from the season totals.

Fantasy by season
GP: Games the player appeared in, however briefly.ESPN: Fantasy points in ESPN’s default points scoring, worked out here from the season line.YAHOO: Fantasy points in Yahoo’s default points scoring, worked out here from the season line.ESPN/G: ESPN fantasy points per game played.YAHOO/G: Yahoo fantasy points per game played.
2008-09PHX60459.0470.67.77.8
2009-10PHX51876.0886.117.217.4
2010-11PHX67795.0844.211.912.6
2011-12PHX64762.0819.811.912.8
2012-13NO821,942.01,949.423.723.8
2013-14POR822,263.02,264.327.627.6
2014-15POR591,326.01,348.322.522.9
2015-16NY822,005.02,037.424.524.8
2016-17CHI811,837.01,897.022.723.4
2017-18CHI641,369.01,384.021.421.6
2018-19CHI741,378.01,351.718.618.3
2019-20MIL66707.0719.710.710.9
2020-21WSH711,190.01,152.916.816.2
2021-22ORL36481.0502.213.414.0
2022-23CLE37210.0206.75.75.6
2023-24MIL1640.040.02.52.5

What the columns mean: GP · ESPN/G

Bio

Age
38 yearsApr 1, 1988
Height
7' 1"
Debut
2008
Draft
2008Rd 1, Pk 15
College
Stanford

Brother of Brook Lopez · All NBA brothers

Latest performance

Robin Lopez

Feb 06 · @ PHX · L 114-106

MIN
18
PTS
6
REB
1
AST
0
STL
1
BLK
2
FG%
37.5
3PTM
0
Most recent games
DateOpponentPTSREBASTMIN
Tue, Feb 06atPHXL 114-10661018
Sun, Feb 04atUTAHL 123-1080104
Sat, Feb 03atDALW 129-1172004
Sat, Jan 27vsNOW 141-1170015
Wed, Jan 24vsCLEW 126-1160001
Wed, Jan 17atCLEL 135-952117

What were Robin Lopez's career stats?

Robin Lopez played 16 seasons for the Suns, the Pelicans, the Trail Blazers, the Knicks, the Bulls, the Bucks, the Wizards, the Magic and the Cavaliers. He scored 8,326 points with 4,659 rebounds and 819 assists in 992 games — 8.4 points, 4.7 rebounds and 0.8 assists per game. His best season was 2012-13: 929 points, 462 rebounds and 64 assists.

League leaderboards and awards

16 seasons, 7 postseasons, 2008-09 to 2023-24

Robin Lopez finished top 10 in a stat 3 times.

All-time career rank

  • 277th in rebounds (4,659)
  • 89th in blocks (1,045)

Among the 2,816 NBA players with a career line on file, regular season. A place deeper than 300th is not listed.

Season top 10 finishes

Among qualified NBA players each season, as the glossary defines each stat. All-time places are among players on file.

Robin Lopez college stats

Robin Lopez played 2 seasons at Stanford Cardinal (2006-07 to 2007-08): 9.0 points, 5.6 rebounds and 0.8 assists a game over 67 games.

Per game

Robin Lopez's college Per game by season
GP: Games the player appeared in, however briefly.GS: Games the player was in the starting five.MIN: Minutes on the floor.FG%: Share of shots from the floor that went in. League average sits near 47%.3P%: Share of three-point attempts that went in. League average sits near 36%.FT%: Share of free throws that went in. League average sits near 78%.OR: Rebounds grabbed at the offensive end, which hand the team a fresh possession.DR: Rebounds grabbed at the defensive end, which end the opponent's possession.REB: Missed shots the player collected, at either end of the floor.AST: Passes that led directly to a team-mate's basket.BLK: Opponent shots swatted away before they reached the rim.STL: Possessions taken off the opponent by picking off a pass or a dribble.PF: Fouls committed. Six in one game and the player is disqualified — lower is better.TO: Possessions handed to the opponent by a bad pass, a lost dribble or an offensive foul — lower is better.PTS: Points scored — a free throw is worth 1, a shot inside the arc 2, beyond it 3.
2006-07Stanford Cardinal3131243.1-6.5480.0-0.001.4-2.554.52.535.50.92.40.22.31.57.5
2007-08Stanford Cardinal363024.53.9-7.353.40.0-0.01002.4-3.765.22.63.15.70.62.30.52.61.810.2

Totals

Robin Lopez's college Totals by season
FG%: Share of shots from the floor that went in. League average sits near 47%.3P%: Share of three-point attempts that went in. League average sits near 36%.FT%: Share of free throws that went in. League average sits near 78%.OR: Rebounds grabbed at the offensive end, which hand the team a fresh possession.DR: Rebounds grabbed at the defensive end, which end the opponent's possession.REB: Missed shots the player collected, at either end of the floor.AST: Passes that led directly to a team-mate's basket.BLK: Opponent shots swatted away before they reached the rim.STL: Possessions taken off the opponent by picking off a pass or a dribble.PF: Fouls committed. Six in one game and the player is disqualified — lower is better.TO: Possessions handed to the opponent by a bad pass, a lost dribble or an offensive foul — lower is better.PTS: Points scored — a free throw is worth 1, a shot inside the arc 2, beyond it 3.
2006-07Stanford Cardinal96-200480-1042-7754.57894172297357246234
2007-08Stanford Cardinal140-26253.41-110086-13265.2931112042283189463367

More

Robin Lopez's college More by season
DD2: Games with double figures in two categories, most often points and rebounds.TD3: Games with double figures in three categories — points, rebounds and assists, usually.EJECT: Times the player was thrown out of a game.TECH: Technical fouls, called for conduct rather than contact: arguing, taunting, hanging on the rim.FLAG: Fouls the officials judged unnecessary or excessive contact; two in a game is an ejection.
2006-07Stanford Cardinal0020100.60.1-1.170.48
2007-08Stanford Cardinal0010100.30.3-1.4010.54

College seasons as ESPN files them for the school he played for.

More on Robin Lopez

Playoff series

Robin Lopez played 38 games across 7 NBA postseasons in 8 series — 2 won, 6 lost.

Robin Lopez's line in each playoff series
PTS: Points scored — a free throw is worth 1, a shot inside the arc 2, beyond it 3.REB: Missed shots the player collected, at either end of the floor.AST: Passes that led directly to a team-mate's basket.
2022-23NYLost 1-124.00.50.0
2020-21PHILost 1-457.41.80.0
2019-20ORLWon 2-132.01.30.0
2016-17BOSLost 2-4612.77.20.8
2014-15MEMLost 1-455.24.40.6
2013-14HOUWon 4-269.78.70.8
2013-14SALost 1-4510.49.80.8
2009-10LALLost 2-467.84.00.0

What the columns mean: PTS · REB · AST

Robin Lopez’s playoff series, round by round

Per game, from NBA game logs since the 1946-47 postseason — earlier series are not counted.