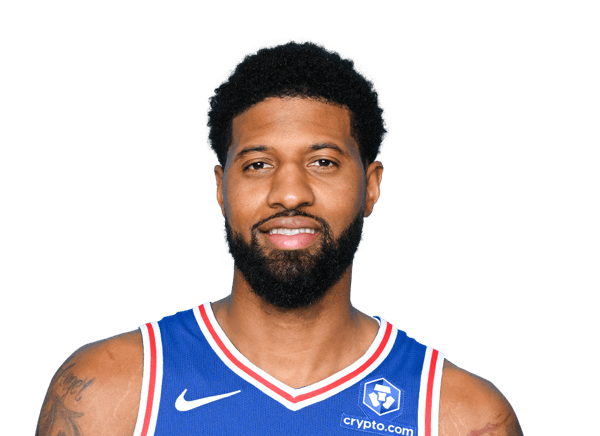
Paul George stats
CelticsBio
- Age
- 36 yearsMay 2, 1990
- Height
- 6' 8"
- Weight
- 221 lbs
- All-NBA Third Team
- 5x

Paul George averaged 20.4 points, 5.2 rebounds and 4.1 assists per game in 9 games of 2026-27 for the Boston Celtics. Last game: .
Stats
Per game
- PTS
- 20.4
- REB
- 5.2
- AST
- 4.1
- STL
- 2.3
- BLK
- 0.4
- TS%
- 60.0
- MIN
- 30.1
- GP
- 9
Ranked among NBA players who qualify (PTS, REB, AST, STL, BLK: 20+ games; TS%: 20+ games, 5+ FGA) that season; only the top 50 are shown. How each stat qualifies: glossary.
Career regular season
- PTS
- 20.5
- REB
- 6.2
- AST
- 3.7
- STL
- 1.7
- BLK
- 0.4
- TS%
- 57.1
- MIN
- 33.5
- GP
- 954
Career Postseason
- PTS
- 20.8
- REB
- 7.2
- AST
- 4.0
- STL
- 1.5
- BLK
- 0.5
- TS%
- 56.4
- MIN
- 38.7
- GP
- 125
Totals
- PTS
- 184
- REB
- 47
- AST
- 37
- STL
- 21
- BLK
- 4
- TO
- 28
- FGM
- 66
- 3PTM
- 31
Career regular season
- PTS
- 19,522
- REB
- 5,927
- AST
- 3,539
- STL
- 1,622
- BLK
- 421
- TO
- 2,515
- FGM
- 6,691
- 3PTM
- 2,480
Per 36 min
- PTS
- 24.4
- REB
- 6.2
- AST
- 4.9
- STL
- 2.8
- BLK
- 0.5
- TS%
- 60.0
- MIN
- 30.1
- GP
- 9
Per 36 minutes: each per-game figure scaled by 36 ÷ minutes played. Derived here, and shooting percentages are left untouched because they do not scale.
Career regular season, Per 36 min
- PTS
- 22.0
- REB
- 6.7
- AST
- 4.0
- STL
- 1.8
- BLK
- 0.4
- TS%
- 57.1
- MIN
- 33.5
- GP
- 954
Fantasy
- GP
- 9
- ESPN
- 365.0
- YAHOO
- 342.9
- ESPN/G
- 40.6
- YAHOO/G
- 38.1
Fantasy points in ESPN’s and Yahoo’s default points leagues, worked out here from the season totals.
Ranked among NBA players with 20+ games that season; only the top 50 are shown. How each stat qualifies: glossary.
Career regular season
- GP
- 954
- ESPN
- 35,686.0
- YAHOO
- 35,556.9
- ESPN/G
- 37.4
- YAHOO/G
- 37.3
Bio
- Age
- 36 yearsMay 2, 1990
- Height
- 6' 8"
- Weight
- 221 lbs
- Experience
- 17 yearsDebut 2010
- Birthplace
- Palmdale, CA
- Draft
- 2010Rd 1, Pk 10
- College
- Fresno State
- Salary
- $54.1 million2026-27
- All-NBA Third Team
- 5x
- All-Defensive First Team
- 2x
- All-Defensive Second Team
- 2x
All awards (6)
- 5x All-NBA Third Team
- 2x All-Defensive First Team
- 2x All-Defensive Second Team
- 1x All-NBA First Team
- 1x All-Rookie Second Team
- 1x Most Improved Player
Latest performance

Paul George
Nov 10 · @ PHI · W 123-101
- MIN
- 30
- PTS
- 36
- REB
- 5
- AST
- 1
- STL
- 0
- BLK
- 0
- FG%
- 63.6
- 3PTM
- 6
Games
All gamesNext
at TORWed, Nov 11
vs TOR since 2011
- 40
- GP
- 830
- PTS
- 270
- REB
- 146
- AST
- 1,437
- MIN
| Date | Opponent | PTS | REB | AST | MIN |
|---|---|---|---|---|---|
| Tue, Nov 10 | at PHIW 123-101 | 36 | 5 | 1 | 30 |
| Sun, Nov 08 | at MILW 117-97 | 27 | 3 | 1 | 28 |
| Fri, Nov 06 | at CHAW 119-80 | 8 | 5 | 1 | 22 |
| Wed, Nov 04 | vsMILW 109-102 | 25 | 3 | 5 | 35 |
| Sun, Nov 01 | at ORLW 108-97 | 17 | 6 | 8 | 33 |
| Fri, Oct 30 | vs CHIW 125-111 | 18 | 6 | 8 | 27 |
What are Paul George's career stats?
Paul George has played 17 seasons for the Pacers, the Thunder, the Clippers, the 76ers and the Celtics. He has scored 19,522 points with 5,927 rebounds and 3,539 assists in 954 games — 20.5 points, 6.2 rebounds and 3.7 assists per game. His best season so far is 2018-19: 2,159 points, 628 rebounds and 318 assists.
Milestones within reach
- 20 more 3-pointers for 2,500 — 2,480 now, 100 in his best season of the last two
- 73 more rebounds for 6,000 — 5,927 now, 196 in his best season of the last two
- 478 more points for 20,000 — 19,522 now, 641 in his best season of the last two
Best single games
- Points: 48 @ UTAH on Dec 5, 2015, L 122-119 OT
- Rebounds: 17 vs SAC on Nov 3, 2012, W 106-98 2OT
- Assists: 12 vs CHA on Feb 13, 2013, W 101-77
- Steals: 8 vs POR on Oct 25, 2021, W 116-86
- Blocks: 4 @ MEM on Mar 19, 2011, L 99-78
- 3-Pointers Made: 10 @ MIA on Feb 1, 2019, W 118-102
Regular season only, from NBA game logs since 2010-11.
League leaderboards and awards
17 seasons, 12 postseasons, 2010-11 to 2026-27
Paul George led the NBA in steals per game (2018-19, 2021-22); finished top 10 in a stat 12 times; sits top 10 all time in 3-pointers made.
Awards
- NBA All-Rookie Second Team: 2010-11
- All-NBA Third Team ×5: 2012-13, 2013-14, 2015-16, 2017-18, 2020-21
- NBA Most Improved Player: 2012-13
- NBA All-Defensive Second Team ×2: 2012-13, 2015-16
- NBA All-Defensive First Team ×2: 2013-14, 2018-19
- All-NBA First Team: 2018-19
All-time career rank
- 57th in points (19,522)
- 175th in rebounds (5,927)
- 167th in assists (3,539)
- 8th in 3-pointers made (2,480)
- 33rd in steals (1,622)
Among the 2,819 NBA players with a career line on file, regular season. A place deeper than 300th is not listed.
Season top 10 finishes
- Points per game: 2015-16 (10th), 2018-19 (2nd)
- Steals per game: 2012-13 (7th), 2013-14 (4th), 2015-16 (9th), 2017-18 (2nd), 2018-19 (1st), 2021-22 (1st), 2024-25 (4th), 2025-26 (9th)
- Free Throw %: 2016-17 (5th), 2023-24 (5th)
Among qualified NBA players each season, as the glossary defines each stat. All-time places are among players on file.
Paul George college stats
Paul George played 2 seasons at Fresno State Bulldogs (2008-09 to 2009-10): 15.5 points, 6.7 rebounds and 2.4 assists a game over 63 games.
Per game
Totals
More
College seasons as ESPN files them for the school he played for.
More on Paul George
Playoff series
Paul George played 125 games across 12 NBA postseasons in 21 series — 9 won, 12 lost.
| PTS: Points scored — a free throw is worth 1, a shot inside the arc 2, beyond it 3. | REB: Missed shots the player collected, at either end of the floor. | AST: Passes that led directly to a team-mate's basket. | ||||
|---|---|---|---|---|---|---|
| 2025-26 |  BOS | Won 4-3 | 7 | 17.4 | 4.0 | 3.0 |
| 2025-26 |  NY | Lost 0-4 | 4 | 14.5 | 3.8 | 3.0 |
| 2023-24 |  DAL | Lost 2-4 | 6 | 19.5 | 6.8 | 4.8 |
| 2020-21 | DAL | Won 4-3 | 7 | 23.6 | 9.0 | 5.7 |
| 2020-21 |  UTAH | Won 4-2 | 6 | 29.0 | 9.5 | 4.8 |
| 2020-21 |  PHX | Lost 2-4 | 6 | 28.7 | 10.5 | 5.5 |
| 2019-20 | DAL | Won 4-2 | 6 | 18.5 | 6.8 | 4.0 |
| 2019-20 |  DEN | Lost 3-4 | 7 | 21.7 | 5.4 | 3.6 |
| 2018-19 |  POR | Lost 1-4 | 5 | 28.6 | 8.6 | 3.6 |
| 2017-18 | UTAH | Lost 2-4 | 6 | 24.7 | 6.0 | 2.7 |
| 2016-17 |  CLE | Lost 0-4 | 4 | 28.0 | 8.8 | 7.3 |
| 2015-16 |  TOR | Lost 3-4 | 7 | 27.3 | 7.6 | 4.3 |
| 2013-14 |  ATL | Won 4-3 | 7 | 23.9 | 10.7 | 4.6 |
| 2013-14 |  WSH | Won 4-2 | 6 | 19.7 | 6.3 | 2.8 |
| 2013-14 |  MIA | Lost 2-4 | 6 | 24.0 | 5.3 | 4.0 |
| 2012-13 | ATL | Won 4-2 | 6 | 18.7 | 9.5 | 5.0 |
| 2012-13 | NY | Won 4-2 | 6 | 19.5 | 7.0 | 5.0 |
| 2012-13 | MIA | Lost 3-4 | 7 | 19.4 | 6.0 | 5.1 |
| 2011-12 | ORL | Won 4-1 | 5 | 9.4 | 7.0 | 2.2 |
| 2011-12 | MIA | Lost 2-4 | 6 | 10.0 | 6.3 | 2.5 |
| 2010-11 | CHI | Lost 1-4 | 5 | 6.0 | 5.0 | 1.0 |
Paul George’s playoff series, round by round
Per game, from NBA game logs since the 1946-47 postseason — earlier series are not counted.
Paul George against each club
- vs Miami Heat (54)
- vs Dallas Mavericks (53)
- vs New York Knicks (50)
- vs Chicago Bulls (49)
- vs Atlanta Hawks (48)
- vs Cleveland Cavaliers (43)
- vs Orlando Magic (43)
- vs Utah Jazz (43)
- vs Denver Nuggets (42)
- vs Minnesota Timberwolves (42)
- vs Detroit Pistons (41)
- vs Toronto Raptors (40)
- vs Washington Wizards (40)
- vs Portland Trail Blazers (39)
- vs Boston Celtics (38)
- vs Charlotte Hornets (38)
- vs Brooklyn Nets (36)
- vs Milwaukee Bucks (36)
- vs New Orleans Pelicans (36)
- vs Phoenix Suns (35)
- vs Philadelphia 76ers (34)
- vs Sacramento Kings (34)
- vs Los Angeles Lakers (33)
- vs San Antonio Spurs (33)
- vs Golden State Warriors (32)
- vs Houston Rockets (31)
- vs Memphis Grizzlies (30)
- vs Oklahoma City Thunder (22)
- vs LA Clippers (19)
- vs Indiana Pacers (13)
Similar players
Closest career per-game profiles to Paul George among NBA players at the same position.
- Kawhi LeonardTORAlike in Points, Rebounds, Steals49out of 100 on profile similarity
- Jayson TatumBOSAlike in 3-Pointers Made, Assists, Rebounds45out of 100 on profile similarity
- Brandon MillerCHAAlike in Points, 3-Pointers Made38out of 100 on profile similarity
- Khris MiddletonWSHAlike in Assists36out of 100 on profile similarity
- Franz WagnerORLAlike in Assists, Points34out of 100 on profile similarity


Compare Paul George with Carmelo Anthony, Kawhi Leonard, Jayson Tatum, Brandon Miller