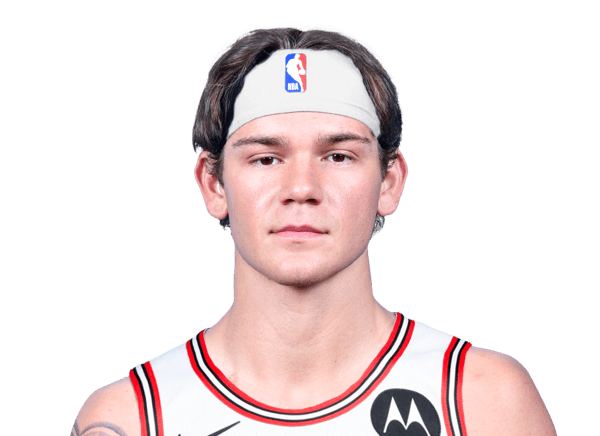
Mac McClung stats
Bio
- Age
- 27 yearsJan 6, 1999
- Height
- 6' 2"
- Weight
- 185 lbs
Mac McClung averaged 6.1 points, 0.9 rebounds and 0.9 assists per game in 11 games of 2025-26. Last game: .
Stats
Per game
- PTS
- 6.1
- REB
- 0.9
- AST
- 0.9
- STL
- 1.0
- BLK
- 0.3
- TS%
- 50.1
- MIN
- 12.3
- GP
- 11
| PTS: Points scored — a free throw is worth 1, a shot inside the arc 2, beyond it 3. | REB: Missed shots the player collected, at either end of the floor. | AST: Passes that led directly to a team-mate's basket. | STL: Possessions taken off the opponent by picking off a pass or a dribble. | BLK: Opponent shots swatted away before they reached the rim. | TS%: Scoring per shot with threes and free throws counted: PTS ÷ (2 × (FGA + 0.44 × FTA)). League average sits near 58%. | MIN: Minutes on the floor. | GP: Games the player appeared in, however briefly. | ||
|---|---|---|---|---|---|---|---|---|---|
| 2021-22 |  LAL/CHI | 4.0 | 1.5 | 0.5 | 0.5 | 0.5 | 62.1 | 12.0 | 2 |
| 2022-23 | PHI | 12.5 | 5.0 | 4.5 | 0.0 | 0.0 | 56.3 | 20.5 | 2 |
| 2024-25 | ORL | 0.0 | 0.5 | 1.5 | 0.0 | 0.0 | 0.0 | 5.0 | 2 |
| 2025-26 | IND/CHI | 6.1 | 0.9 | 0.9 | 1.0 | 0.3 | 50.1 | 12.3 | 11 |
What the columns mean: PTS · REB · AST · STL · BLK · TS% · MIN · GP
Career regular season
- PTS
- 5.9
- REB
- 1.4
- AST
- 1.4
- STL
- 0.7
- BLK
- 0.2
- TS%
- 51.3
- MIN
- 12.4
- GP
- 17
Totals
- PTS
- 67
- REB
- 10
- AST
- 10
- STL
- 11
- BLK
- 3
- TO
- 9
- FGM
- 23
- 3PTM
- 7
| PTS: Points scored — a free throw is worth 1, a shot inside the arc 2, beyond it 3. | REB: Missed shots the player collected, at either end of the floor. | AST: Passes that led directly to a team-mate's basket. | STL: Possessions taken off the opponent by picking off a pass or a dribble. | BLK: Opponent shots swatted away before they reached the rim. | TO: Possessions handed to the opponent by a bad pass, a lost dribble or an offensive foul — lower is better. | FGM: Shots made from the floor — everything except free throws. | 3PTM: Three-point shots made. | ||
|---|---|---|---|---|---|---|---|---|---|
| 2021-22 | LAL/CHI | 8 | 3 | 1 | 1 | 1 | 3 | 3 | 1 |
| 2022-23 | PHI | 25 | 10 | 9 | 0 | 0 | 3 | 9 | 4 |
| 2024-25 | ORL | 0 | 1 | 3 | 0 | 0 | 0 | 0 | 0 |
| 2025-26 | IND/CHI | 67 | 10 | 10 | 11 | 3 | 9 | 23 | 7 |
What the columns mean: PTS · REB · AST · STL · BLK · TO · FGM · 3PTM
Career regular season
- PTS
- 100
- REB
- 24
- AST
- 23
- STL
- 12
- BLK
- 4
- TO
- 15
- FGM
- 35
- 3PTM
- 12
Per 36 min
- PTS
- 17.9
- REB
- 2.6
- AST
- 2.6
- STL
- 2.9
- BLK
- 0.9
- TS%
- 50.1
- MIN
- 12.3
- GP
- 11
Per 36 minutes: each per-game figure scaled by 36 ÷ minutes played. Derived here, and shooting percentages are left untouched because they do not scale.
| PTS: Points scored — a free throw is worth 1, a shot inside the arc 2, beyond it 3. | REB: Missed shots the player collected, at either end of the floor. | AST: Passes that led directly to a team-mate's basket. | STL: Possessions taken off the opponent by picking off a pass or a dribble. | BLK: Opponent shots swatted away before they reached the rim. | TS%: Scoring per shot with threes and free throws counted: PTS ÷ (2 × (FGA + 0.44 × FTA)). League average sits near 58%. | MIN: Minutes on the floor. | GP: Games the player appeared in, however briefly. | ||
|---|---|---|---|---|---|---|---|---|---|
| 2021-22 | LAL/CHI | 12.0 | 4.5 | 1.5 | 1.5 | 1.5 | 62.1 | 12.0 | 2 |
| 2022-23 | PHI | 22.0 | 8.8 | 7.9 | 0.0 | 0.0 | 56.3 | 20.5 | 2 |
| 2024-25 | ORL | 0.0 | 3.6 | 10.8 | 0.0 | 0.0 | 0.0 | 5.0 | 2 |
| 2025-26 | IND/CHI | 17.9 | 2.6 | 2.6 | 2.9 | 0.9 | 50.1 | 12.3 | 11 |
What the columns mean: PTS · REB · AST · STL · BLK · TS% · MIN · GP
Career regular season, Per 36 min
- PTS
- 17.1
- REB
- 4.1
- AST
- 4.1
- STL
- 2.0
- BLK
- 0.6
- TS%
- 51.3
- MIN
- 12.4
- GP
- 17
Fantasy
- GP
- 11
- ESPN
- 125.0
- YAHOO
- 127.0
- ESPN/G
- 11.4
- YAHOO/G
- 11.5
Fantasy points in ESPN’s and Yahoo’s default points leagues, worked out here from the season totals.
| GP: Games the player appeared in, however briefly. | ESPN: Fantasy points in ESPN’s default points scoring, worked out here from the season line. | YAHOO: Fantasy points in Yahoo’s default points scoring, worked out here from the season line. | ESPN/G: ESPN fantasy points per game played. | YAHOO/G: Yahoo fantasy points per game played. | ||
|---|---|---|---|---|---|---|
| 2021-22 | LAL/CHI | 2 | 16.0 | 16.1 | 8.0 | 8.1 |
| 2022-23 | PHI | 2 | 47.0 | 47.5 | 23.5 | 23.8 |
| 2024-25 | ORL | 2 | 5.0 | 5.7 | 2.5 | 2.9 |
| 2025-26 | IND/CHI | 11 | 125.0 | 127.0 | 11.4 | 11.5 |
Career regular season
- GP
- 17
- ESPN
- 193.0
- YAHOO
- 196.3
- ESPN/G
- 11.4
- YAHOO/G
- 11.5
Bio
- Age
- 27 yearsJan 6, 1999
- Height
- 6' 2"
- Weight
- 185 lbs
- Experience
- 4 years
- Birthplace
- Gate City, VA
- College
- Texas Tech
Latest performance

Mac McClung
Apr 12 · @ DAL · L 149-128
- MIN
- 18
- PTS
- 13
- REB
- 0
- AST
- 0
- STL
- 1
- BLK
- 0
- FG%
- 57.1
- 3PTM
- 2
Games
All games| Date | Opponent | PTS | REB | AST | MIN |
|---|---|---|---|---|---|
| Sun, Apr 12 | at DALL 149-128 | 13 | 0 | 0 | 18 |
| Fri, Apr 10 | vs ORLL 127-103 | 7 | 1 | 1 | 10 |
| Thu, Apr 09 | at WSHW 119-108 | 2 | 2 | 2 | 15 |
| Tue, Apr 07 | atWSHW 129-98 | 5 | 0 | 3 | 18 |
| Sun, Apr 05 | vs PHXL 120-110 | 9 | 0 | 1 | 11 |
| Fri, Apr 03 | at NYL 136-96 | 0 | 0 | 1 | 5 |
What are Mac McClung's career stats?
Mac McClung has played 4 seasons for the 76ers and the Magic. He has scored 100 points with 24 rebounds and 23 assists in 17 games — 5.9 points, 1.4 rebounds and 1.4 assists per game. His best season so far is 2025-26: 67 points, 10 rebounds and 10 assists.
Best single games
- Points: 20 @ BKN on Apr 9, 2023, W 134-105
- Rebounds: 9 @ BKN on Apr 9, 2023, W 134-105
- Assists: 9 @ BKN on Apr 9, 2023, W 134-105
- Steals: 3 @ WSH on Apr 9, 2026, W 119-108
- Blocks: 1 @ DEN on Apr 10, 2022, W 146-141 OT
- 3-Pointers Made: 3 @ BKN on Apr 9, 2023, W 134-105
Regular season only, from NBA game logs since 2021-22.
Mac McClung college stats
Mac McClung played 3 seasons at Georgetown Hoyas and Texas Tech Red Raiders (2018-19 to 2020-21): 14.7 points, 2.8 rebounds and 2.2 assists a game over 79 games.
Per game
Totals
More
College seasons as ESPN files them for the school he played for.
More on Mac McClung
Mac McClung against each club
- vs Washington Wizards (4)
- vs Atlanta Hawks (3)
- vs Brooklyn Nets (2)
- vs Dallas Mavericks (2)
- vs Phoenix Suns (2)
- vs Denver Nuggets (1)
- vs Golden State Warriors (1)
- vs Indiana Pacers (1)
- vs Memphis Grizzlies (1)
- vs Milwaukee Bucks (1)
- vs New York Knicks (1)
- vs Orlando Magic (1)
- vs Philadelphia 76ers (1)
- vs San Antonio Spurs (1)
- vs Toronto Raptors (1)
Similar players
Closest career per-game profiles to Mac McClung among NBA players at the same position.
- Jevon CarterORLAlike in Blocks, Points70out of 100 on profile similarity
- Garrett TempleAlike in Points, Assists69out of 100 on profile similarity
- Kira Lewis Jr.Alike in Rebounds, Points66out of 100 on profile similarity
- Brandon Boston Jr.Alike in 3-Pointers Made, Assists63out of 100 on profile similarity
- Aaron HolidayAlike in Rebounds, Points61out of 100 on profile similarity


Compare Mac McClung with Jevon Carter, Garrett Temple, Kira Lewis Jr.