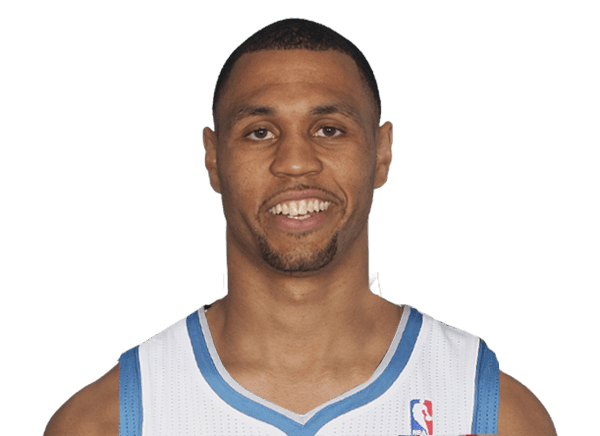
Brandon Roy stats

Last played for the Minnesota Timberwolves, 2012-13

Shooting Guard · #3

Age 42 · 6' 6"

Compare with…

Brandon Roy played 6 NBA seasons, 2006-07 to 2012-13.

Stats

Choose how these numbers are shown

Per game

Career regular season

PTS
18.8
REB
4.3
AST
4.7
STL
1.0
BLK
0.2
TS%
54.8
MIN
35.5
GP
326

Ranked among NBA players who qualify (PTS, REB, AST, STL, BLK: 20+ games; TS%: 20+ games, 5+ FGA) that season; only the top 50 are shown. How each stat qualifies: glossary.

Per game by season
PTS: Points scored — a free throw is worth 1, a shot inside the arc 2, beyond it 3.REB: Missed shots the player collected, at either end of the floor.AST: Passes that led directly to a team-mate's basket.STL: Possessions taken off the opponent by picking off a pass or a dribble.BLK: Opponent shots swatted away before they reached the rim.TS%: Scoring per shot with threes and free throws counted: PTS ÷ (2 × (FGA + 0.44 × FTA)). League average sits near 58%.MIN: Minutes on the floor.GP: Games the player appeared in, however briefly.
2006-07POR16.84.44.01.20.254.835.457
2007-08POR19.14.75.81.10.253.137.774
2008-09POR22.64.75.11.10.357.337.278
2009-10POR21.54.44.70.90.256.837.265
2010-11POR12.22.62.70.80.349.127.947
2012-13MIN5.82.84.60.60.036.824.45

What the columns mean: PTS · REB · AST · STL · BLK · TS% · MIN · GP

Career Postseason

PTS
16.3
REB
3.3
AST
2.6
STL
0.6
BLK
0.5
TS%
53.5
MIN
30.6
GP
15

Totals

Career regular season

PTS
6,136
REB
1,388
AST
1,517
STL
335
BLK
76
TO
595
FGM
2,224
3PTM
322
Totals by season
PTS: Points scored — a free throw is worth 1, a shot inside the arc 2, beyond it 3.REB: Missed shots the player collected, at either end of the floor.AST: Passes that led directly to a team-mate's basket.STL: Possessions taken off the opponent by picking off a pass or a dribble.BLK: Opponent shots swatted away before they reached the rim.TO: Possessions handed to the opponent by a bad pass, a lost dribble or an offensive foul — lower is better.FGM: Shots made from the floor — everything except free throws.3PTM: Three-point shots made.
2006-07POR955250230671011634955
2007-08POR1,416348430791613653173
2008-09POR1,765370400882215263383
2009-10POR1,398285305611612949173
2010-11POR57312112937125520938
2012-13MIN291423307110

What the columns mean: PTS · REB · AST · STL · BLK · TO · FGM · 3PTM

Per 36 min

Career regular season

PTS
19.1
REB
4.4
AST
4.8
STL
1.0
BLK
0.2
TS%
54.8
MIN
35.5
GP
326

Per 36 minutes: each per-game figure scaled by 36 ÷ minutes played. Derived here, and shooting percentages are left untouched because they do not scale.

Per 36 min by season
PTS: Points scored — a free throw is worth 1, a shot inside the arc 2, beyond it 3.REB: Missed shots the player collected, at either end of the floor.AST: Passes that led directly to a team-mate's basket.STL: Possessions taken off the opponent by picking off a pass or a dribble.BLK: Opponent shots swatted away before they reached the rim.TS%: Scoring per shot with threes and free throws counted: PTS ÷ (2 × (FGA + 0.44 × FTA)). League average sits near 58%.MIN: Minutes on the floor.GP: Games the player appeared in, however briefly.
2006-07POR17.14.54.11.20.254.835.457
2007-08POR18.24.55.51.10.253.137.774
2008-09POR21.94.54.91.10.357.337.278
2009-10POR20.84.34.50.90.256.837.265
2010-11POR15.73.43.51.00.449.127.947
2012-13MIN8.64.16.80.90.036.824.45

What the columns mean: PTS · REB · AST · STL · BLK · TS% · MIN · GP

Fantasy

Career regular season

GP
326
ESPN
10,592.0
YAHOO
10,715.1
ESPN/G
32.5
YAHOO/G
32.9

Fantasy points in ESPN’s and Yahoo’s default points leagues, worked out here from the season totals.

Ranked among NBA players with 20+ games that season; only the top 50 are shown. How each stat qualifies: glossary.

Fantasy by season
GP: Games the player appeared in, however briefly.ESPN: Fantasy points in ESPN’s default points scoring, worked out here from the season line.YAHOO: Fantasy points in Yahoo’s default points scoring, worked out here from the season line.ESPN/G: ESPN fantasy points per game played.YAHOO/G: Yahoo fantasy points per game played.
2006-07POR571,690.01,715.029.630.1
2007-08POR742,605.02,627.635.235.5
2008-09POR783,013.02,987.038.638.3
2009-10POR652,263.02,299.534.835.4
2010-11POR47950.01,003.720.221.4
2012-13MIN571.082.314.216.5

What the columns mean: GP · ESPN/G

Bio

Age
42 yearsJul 23, 1984
Height
6' 6"
Debut
2006
Birthplace
Seattle, WA
Draft
2006Rd 1, Pk 6
College
Washington
Rookie of the Year
2006-07
All-NBA Second Team
2008-09
All-NBA Third Team
2009-10
All awards (4)
  • 1x Rookie of the Year
  • 1x All-NBA Second Team
  • 1x All-NBA Third Team
  • 1x All-Rookie First Team

Latest performance

Brandon Roy

Nov 09 · vs IND · W 96-94

MIN
15
PTS
6
REB
1
AST
1
STL
1
BLK
0
FG%
60.0
3PTM
0
Most recent games
DateOpponentPTSREBASTMIN
Fri, Nov 09vsINDW 96-9461115
Wed, Nov 07vsORLW 90-7535926
Mon, Nov 05atBKNW 107-9662729
Sun, Nov 04atTORL 105-8641022
Fri, Nov 02vsSACW 92-80105630
Thu, Apr 28vsDALL 103-9693329

What were Brandon Roy's career stats?

Brandon Roy played 6 seasons for the Trail Blazers and the Timberwolves. He scored 6,136 points with 1,388 rebounds and 1,517 assists in 326 games — 18.8 points, 4.3 rebounds and 4.7 assists per game. His best season was 2008-09: 1,765 points, 370 rebounds and 400 assists.

League leaderboards and awards

6 seasons, 3 postseasons, 2006-07 to 2012-13

Awards

Brandon Roy college stats

Brandon Roy played 4 seasons at Washington Huskies (2002-03 to 2005-06): 14.3 points, 5.0 rebounds and 3.0 assists a game over 103 games.

Per game

Brandon Roy's college Per game by season
GP: Games the player appeared in, however briefly.GS: Games the player was in the starting five.MIN: Minutes on the floor.FG%: Share of shots from the floor that went in. League average sits near 47%.3P%: Share of three-point attempts that went in. League average sits near 36%.FT%: Share of free throws that went in. League average sits near 78%.OR: Rebounds grabbed at the offensive end, which hand the team a fresh possession.DR: Rebounds grabbed at the defensive end, which end the opponent's possession.REB: Missed shots the player collected, at either end of the floor.AST: Passes that led directly to a team-mate's basket.BLK: Opponent shots swatted away before they reached the rim.STL: Possessions taken off the opponent by picking off a pass or a dribble.PF: Fouls committed. Six in one game and the player is disqualified — lower is better.TO: Possessions handed to the opponent by a bad pass, a lost dribble or an offensive foul — lower is better.PTS: Points scored — a free throw is worth 1, a shot inside the arc 2, beyond it 3.
2002-03Washington Huskies13217.22.3-4.6500.1-0.8101.4-2.848.61.21.72.910.20.31.21.46.1
2003-04Washington Huskies313130.34.6-9.7480.2-0.922.23.4-4.478.51.53.85.33.30.41.22.42.712.9
2004-05Washington Huskies26524.25.0-8.956.50.3-0.8352.4-3.374.12.12.952.20.30.61.91.512.8
2005-06Washington Huskies333331.76.9-13.650.81.2-2.940.25.2-6.4812.13.55.64.10.81.42.52.320.2

Totals

Brandon Roy's college Totals by season
FG%: Share of shots from the floor that went in. League average sits near 47%.3P%: Share of three-point attempts that went in. League average sits near 36%.FT%: Share of free throws that went in. League average sits near 78%.OR: Rebounds grabbed at the offensive end, which hand the team a fresh possession.DR: Rebounds grabbed at the defensive end, which end the opponent's possession.REB: Missed shots the player collected, at either end of the floor.AST: Passes that led directly to a team-mate's basket.BLK: Opponent shots swatted away before they reached the rim.STL: Possessions taken off the opponent by picking off a pass or a dribble.PF: Fouls committed. Six in one game and the player is disqualified — lower is better.TO: Possessions handed to the opponent by a bad pass, a lost dribble or an offensive foul — lower is better.PTS: Points scored — a free throw is worth 1, a shot inside the arc 2, beyond it 3.
2002-03Washington Huskies30-60501-101018-3748.61622381334161879
2003-04Washington Huskies144-300486-2722.2106-13578.54611816410211377484400
2004-05Washington Huskies131-23256.57-203563-8574.15475129589165040332
2005-06Washington Huskies228-44950.839-9740.2171-211816911718613526468175666

More

Brandon Roy's college More by season
DD2: Games with double figures in two categories, most often points and rebounds.TD3: Games with double figures in three categories — points, rebounds and assists, usually.EJECT: Times the player was thrown out of a game.TECH: Technical fouls, called for conduct rather than contact: arguing, taunting, hanging on the rim.FLAG: Fouls the officials judged unnecessary or excessive contact; two in a game is an ejection.
2002-03Washington Huskies0000000.70.2-1.3170.51
2003-04Washington Huskies0010001.20.4-1.3330.49
2004-05Washington Huskies0010101.50.4-1.4310.58
2005-06Washington Huskies0040101.80.6-1.4830.55

College seasons as ESPN files them for the school he played for.

More on Brandon Roy

Playoff series

Brandon Roy played 15 games across 3 NBA postseasons in 3 series — 0 won, 3 lost.

Brandon Roy's line in each playoff series
PTS: Points scored — a free throw is worth 1, a shot inside the arc 2, beyond it 3.REB: Missed shots the player collected, at either end of the floor.AST: Passes that led directly to a team-mate's basket.
2010-11DALLost 2-469.32.22.8
2009-10PHXLost 1-239.72.31.7
2008-09HOULost 2-4626.74.82.8

What the columns mean: PTS · REB · AST

Brandon Roy’s playoff series, round by round

Per game, from NBA game logs since the 1946-47 postseason — earlier series are not counted.