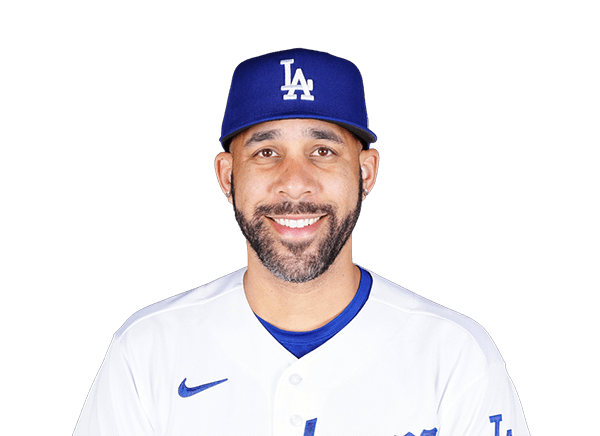
David Price stats
Bio
- Age
- 41 yearsAug 26, 1985
- Height
- 6' 5"
- AL Cy Young
- 2012
David Price played 14 MLB seasons, 2008 to 2022.
Stats
Standard
Career regular season
- GP
- 400
- W
- 157
- L
- 82
- ERA
- 3.32
- IP
- 2,143.2
- K
- 2,076
- BB
- 562
- WHIP
- 1.16
Ranked among MLB players who qualify (W, IP, K: 10+ games; ERA, WHIP: 100+ IP) that season; only the top 50 are shown. How each stat qualifies: glossary.
| GP: Games the player appeared in, however briefly. | W: Games in which this pitcher was credited with the win. | L: Games in which this pitcher was charged with the loss. | ERA: Earned runs allowed per nine innings pitched — lower is better. Under 3.00 is excellent. | IP: Innings pitched. The decimal counts outs, so 6.2 is six innings and two more outs. | K: Batters this pitcher struck out. | BB: Times the batter reached first base on four balls. | WHIP: Walks and hits allowed per inning pitched — lower is better. Around 1.00 is elite. | ||
|---|---|---|---|---|---|---|---|---|---|
| 2008 | TB | 5 | 0 | 0 | 1.93 | 14.0 | 12 | 4 | 0.93 |
| 2009 | TB | 23 | 10 | 7 | 4.42 | 128.1 | 102 | 54 | 1.35 |
| 2010 | TB | 32 | 19 | 6 | 2.72 | 208.2 | 188 | 79 | 1.19 |
| 2011 | TB | 34 | 12 | 13 | 3.49 | 224.1 | 218 | 63 | 1.14 |
| 2012 | TB | 31 | 20 | 5 | 2.56 | 211.0 | 205 | 59 | 1.10 |
| 2013 | TB | 27 | 10 | 8 | 3.33 | 186.2 | 151 | 27 | 1.10 |
| 2014 |  TB/DET | 34 | 15 | 12 | 3.26 | 248.1 | 271 | 38 | 1.08 |
| 2015 |  DET/TOR | 32 | 18 | 5 | 2.45 | 220.1 | 225 | 47 | 1.08 |
| 2016 | BOS | 35 | 17 | 9 | 3.99 | 230.0 | 228 | 50 | 1.20 |
| 2017 | BOS | 16 | 6 | 3 | 3.38 | 74.2 | 76 | 24 | 1.19 |
| 2018 | BOS | 30 | 16 | 7 | 3.58 | 176.0 | 177 | 50 | 1.14 |
| 2019 | BOS | 22 | 7 | 5 | 4.28 | 107.1 | 128 | 32 | 1.31 |
| 2021 | LAD | 39 | 5 | 2 | 4.03 | 73.2 | 58 | 26 | 1.43 |
| 2022 | LAD | 40 | 2 | 0 | 2.45 | 40.1 | 37 | 9 | 1.17 |
Career Postseason
- GP
- 23
- W
- 5
- L
- 9
- ERA
- 4.62
- IP
- 99.1
- K
- 91
- BB
- 28
- WHIP
- 1.20
Expanded
Career regular season
- QS
- 203
- CG
- 17
- SHO
- 3
- K/9
- 8.7
- GB
- 2,769
- FB
- 3,327
- G/F
- 0.80
- WP
- 40
Ranked among MLB players who qualify (QS, CG, SHO: 10+ GS; K/9: 100+ IP; G/F: 50+ IP) that season; only the top 50 are shown. How each stat qualifies: glossary.
| QS: Quality starts: six innings or more with no more than three earned runs. | CG: Complete games, pitched from the first out to the last. | SHO: Shutouts — complete games with no run allowed. | K/9: Strikeouts for every nine innings pitched. | GB: Ground balls hit against this pitcher. | FB: Fly balls hit against this pitcher. | G/F: Ground balls for every fly ball hit against this pitcher. | WP: Wild pitches — throws the catcher had no chance to stop. | ||
|---|---|---|---|---|---|---|---|---|---|
| 2008 | TB | 0 | 0 | 0 | 7.7 | 21 | 19 | 1.1 | 0 |
| 2009 | TB | 10 | 0 | 0 | 7.2 | 170 | 226 | 0.8 | 2 |
| 2010 | TB | 25 | 2 | 1 | 8.1 | 267 | 322 | 0.8 | 5 |
| 2011 | TB | 21 | 0 | 0 | 8.7 | 287 | 338 | 0.8 | 2 |
| 2012 | TB | 25 | 2 | 1 | 8.7 | 306 | 259 | 1.2 | 8 |
| 2013 | TB | 18 | 4 | 0 | 7.3 | 264 | 295 | 0.9 | 6 |
| 2014 | TB/DET | 24 | 3 | 0 | 9.8 | 300 | 392 | 0.8 | 2 |
| 2015 | DET/TOR | 24 | 3 | 1 | 9.2 | 259 | 354 | 0.7 | 4 |
| 2016 | BOS | 22 | 2 | 0 | 8.9 | 299 | 367 | 0.8 | 4 |
| 2017 | BOS | 7 | 0 | 0 | 9.2 | 86 | 127 | 0.7 | 2 |
| 2018 | BOS | 18 | 1 | 0 | 9.1 | 199 | 286 | 0.7 | 1 |
| 2019 | BOS | 9 | 0 | 0 | 10.7 | 123 | 172 | 0.7 | 3 |
| 2021 | LAD | 0 | 0 | 0 | 7.1 | 120 | 117 | 1 | 1 |
| 2022 | LAD | 0 | 0 | 0 | 8.3 | 68 | 53 | 1.3 | 0 |
Bio
- Age
- 41 yearsAug 26, 1985
- Height
- 6' 5"
- Debut
- 2008
- Birthplace
- Murfreesboro, TN
- Draft
- 2007Rd 1, Pk 1
- College
- Vanderbilt
- AL Cy Young
- 2012
Latest performance

David Price
Sep 30 · vs COL · W 10-1
- IP
- 1.0
- H
- 1
- R
- 0
- ER
- 0
- BB
- 0
- K
- 0
- HR
- 0
- ERA
- 2.45
Games
All games| Date | Opponent | IP | H | R | ER | K |
|---|---|---|---|---|---|---|
| Fri, Sep 30 | vs COLW 10-1 | 1 | 1 | 0 | 0 | 0 |
| Thu, Sep 29 | at SDW 5-2 | 1 | 0 | 0 | 0 | 0 |
| Mon, Aug 29 | at MIAW 3-2 F/10 | 0.1 | 1 | 0 | 0 | 0 |
| Fri, Aug 26 | atMIAW 10-6 F/10 | 1 | 1 | 1 | 1 | 0 |
| Tue, Aug 23 | vs MILW 10-1 | 1.2 | 1 | 0 | 0 | 1 |
| Sun, Aug 21 | vsMIAW 10-3 | 1 | 1 | 1 | 1 | 0 |
What were David Price's career stats?
David Price played 14 seasons for the Rays, the Red Sox and the Dodgers. He had 157 wins and 2,076 strikeouts with a 3.32 ERA over 2,143.2 innings. His best season was 2012: 20 wins, a 2.56 ERA and 205 strikeouts.
League leaderboards and awards
14 seasons, 8 postseasons, 2008 to 2022
David Price led MLB in strikeouts (pitching) (2014); finished top 10 in a stat 12 times.
Championships
- 2018 World Series with the Boston Red Sox
Awards
All-time career rank
- 79th in strikeouts (pitching) (2,076)
- 234th in wins (pitching) (157)
Among the 9,243 MLB players with a career line on file, regular season. A place deeper than 300th is not listed.
Season top 10 finishes
- Wins: 2010 (4th), 2012 (2nd), 2015 (6th), 2016 (8th)
- ERA: 2010 (8th), 2012 (3rd), 2015 (5th)
- Strikeouts (Pitching): 2011 (9th), 2014 (1st), 2015 (8th), 2016 (7th)
- WHIP: 2012 (9th)
Among qualified MLB players each season, as the glossary defines each stat. All-time places are among players on file.
More on David Price
Playoff series
David Price played 23 games across 9 MLB postseasons in 13 series — 3 won, 10 lost.
| IP: Innings pitched. The decimal counts outs, so 6.2 is six innings and two more outs. | H: Times the batter reached base by hitting the ball, without help from an error. | ER: Earned runs allowed — runs that scored without help from an error. | K: Batters this pitcher struck out. | ||||
|---|---|---|---|---|---|---|---|
| 2018 |  NYY | Lost 0-1 | 1 | 1.2 | 3 | 3 | 0 |
| 2018 |  HOU | Won 2-0 | 2 | 10.2 | 8 | 4 | 13 |
| 2018 |  LAD | Won 2-1 | 3 | 13.2 | 7 | 3 | 10 |
| 2017 | HOU | Lost 1-1 | 2 | 6.2 | 5 | 0 | 6 |
| 2016 |  CLE | Lost 0-1 | 1 | 3.1 | 6 | 5 | 3 |
| 2015 |  TEX | Lost 1-1 | 2 | 10.0 | 11 | 8 | 7 |
| 2015 |  KC | Lost 0-2 | 2 | 13.1 | 11 | 8 | 16 |
| 2014 |  BAL | Lost 0-1 | 1 | 8.0 | 5 | 2 | 6 |
| 2013 |  BOS | Lost 0-1 | 1 | 7.0 | 9 | 7 | 5 |
| 2011 | TEX | Lost 0-1 | 1 | 6.2 | 7 | 3 | 3 |
| 2010 | TEX | Lost 0-2 | 2 | 12.2 | 17 | 7 | 14 |
| 2008 | BOS | Won 2-1 | 3 | 2.1 | 0 | 0 | 4 |
| 2008 |  PHI | Lost 1-1 | 2 | 3.1 | 2 | 1 | 4 |
David Price’s playoff series, round by round
Totals, from MLB game logs since the 2001 postseason — earlier series are not counted.
David Price against each club
- vs New York Yankees (45)
- vs Toronto Blue Jays (32)
- vs Baltimore Orioles (31)
- vs Boston Red Sox (27)
- vs Texas Rangers (22)
- vs Minnesota Twins (21)
- vs Los Angeles Angels (19)
- vs Tampa Bay Rays (19)
- vs Chicago White Sox (18)
- vs Cleveland Guardians (18)
- vs Houston Astros (17)
- vs Colorado Rockies (14)
- vs Arizona Diamondbacks (12)
- vs Athletics (12)
- vs Kansas City Royals (12)
- vs San Francisco Giants (12)
- vs Detroit Tigers (10)
- vs Philadelphia Phillies (10)
- vs Seattle Mariners (9)
- vs Cincinnati Reds (8)
- vs Miami Marlins (8)
- vs San Diego Padres (8)
- vs Atlanta Braves (7)
- vs Milwaukee Brewers (7)
- vs Los Angeles Dodgers (6)
- vs Washington Nationals (5)
- vs Chicago Cubs (4)
- vs Pittsburgh Pirates (4)
- vs New York Mets (3)
- vs St. Louis Cardinals (3)
Similar players
Closest career per-game profiles to David Price among MLB players at the same position.
- Hyun Jin RyuAlike in ERA, WHIP, Strikeouts89out of 100 on profile similarity
- Johan SantanaAlike in Wins, WHIP, ERA87out of 100 on profile similarity
- Cristopher SanchezPHIAlike in Innings pitched, ERA, WHIP86out of 100 on profile similarity
- Zack GreinkeAlike in WHIP, Wins, Strikeouts85out of 100 on profile similarity
- Luis GarciaAlike in Strikeouts, Wins, Innings pitched82out of 100 on profile similarity


Compare David Price with Hyun Jin Ryu, Johan Santana, Cristopher Sanchez