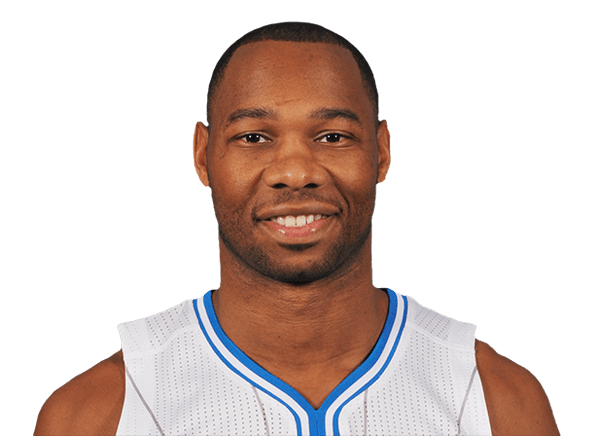
Willie Green stats

Last played for the Orlando Magic, 2014-15

Shooting Guard · #34

Age 45 · 6' 3"

Compare with…

Willie Green played 12 NBA seasons, 2003-04 to 2014-15.

Stats

Choose how these numbers are shown

Per game

Career regular season

PTS
8.3
REB
1.8
AST
1.4
STL
0.5
BLK
0.1
TS%
49.8
MIN
20.2
GP
731

Ranked among NBA players who qualify (PTS, REB, AST, STL, BLK: 20+ games; TS%: 20+ games, 5+ FGA) that season; only the top 50 are shown. How each stat qualifies: glossary.

Per game by season
PTS: Points scored — a free throw is worth 1, a shot inside the arc 2, beyond it 3.REB: Missed shots the player collected, at either end of the floor.AST: Passes that led directly to a team-mate's basket.STL: Possessions taken off the opponent by picking off a pass or a dribble.BLK: Opponent shots swatted away before they reached the rim.TS%: Scoring per shot with threes and free throws counted: PTS ÷ (2 × (FGA + 0.44 × FTA)). League average sits near 58%.MIN: Minutes on the floor.GP: Games the player appeared in, however briefly.
2003-04PHI6.91.21.00.50.146.414.553
2004-05PHI7.72.31.80.60.145.718.757
2005-06PHI7.01.50.50.20.051.315.310
2006-07PHI11.32.11.50.80.145.824.974
2007-08PHI12.42.52.00.70.349.226.674
2008-09PHI8.51.62.00.70.249.322.681
2009-10PHI8.71.82.10.40.253.821.373
2010-11NO8.72.11.00.50.251.521.777
2011-12ATL7.61.50.80.40.157.817.453
2012-13LAC6.31.30.80.40.256.216.572
2013-14LAC5.01.40.90.40.247.715.855
2014-15ORL5.91.51.30.50.147.718.352

What the columns mean: PTS · REB · AST · STL · BLK · TS% · MIN · GP

Career Postseason

PTS
5.2
REB
1.3
AST
0.9
STL
0.3
BLK
0.1
TS%
48.0
MIN
15
GP
36

Totals

Career regular season

PTS
6,059
REB
1,303
AST
1,018
STL
393
BLK
108
TO
705
FGM
2,417
3PTM
517
Totals by season
PTS: Points scored — a free throw is worth 1, a shot inside the arc 2, beyond it 3.REB: Missed shots the player collected, at either end of the floor.AST: Passes that led directly to a team-mate's basket.STL: Possessions taken off the opponent by picking off a pass or a dribble.BLK: Opponent shots swatted away before they reached the rim.TO: Possessions handed to the opponent by a bad pass, a lost dribble or an offensive foul — lower is better.FGM: Shots made from the floor — everything except free throws.3PTM: Three-point shots made.
2003-04PHI36465532655914319
2004-05PHI4371331003467515530
2005-06PHI7015520122810
2006-07PHI83915811256410635751
2007-08PHI921182151542210937951
2008-09PHI68512615853136428651
2009-10PHI63812915232116724847
2010-11NO6721617436136727054
2011-12ATL40480402363315350
2012-13LAC450975529123117871
2013-14LAC273785022113410241
2014-15ORL30679682654811842

What the columns mean: PTS · REB · AST · STL · BLK · TO · FGM · 3PTM

Per 36 min

Career regular season

PTS
14.8
REB
3.2
AST
2.5
STL
0.9
BLK
0.2
TS%
49.8
MIN
20.2
GP
731

Per 36 minutes: each per-game figure scaled by 36 ÷ minutes played. Derived here, and shooting percentages are left untouched because they do not scale.

Per 36 min by season
PTS: Points scored — a free throw is worth 1, a shot inside the arc 2, beyond it 3.REB: Missed shots the player collected, at either end of the floor.AST: Passes that led directly to a team-mate's basket.STL: Possessions taken off the opponent by picking off a pass or a dribble.BLK: Opponent shots swatted away before they reached the rim.TS%: Scoring per shot with threes and free throws counted: PTS ÷ (2 × (FGA + 0.44 × FTA)). League average sits near 58%.MIN: Minutes on the floor.GP: Games the player appeared in, however briefly.
2003-04PHI17.13.02.51.20.246.414.553
2004-05PHI14.84.43.51.20.245.718.757
2005-06PHI16.53.51.20.50.051.315.310
2006-07PHI16.33.02.21.20.145.824.974
2007-08PHI16.83.42.70.90.449.226.674
2008-09PHI13.52.53.21.10.349.322.681
2009-10PHI14.73.03.50.70.353.821.373
2010-11NO14.43.51.70.80.351.521.777
2011-12ATL15.73.11.70.80.257.817.453
2012-13LAC13.72.81.70.90.456.216.572
2013-14LAC11.43.22.10.90.547.715.855
2014-15ORL11.63.02.61.00.247.718.352

What the columns mean: PTS · REB · AST · STL · BLK · TS% · MIN · GP

Fantasy

Career regular season

GP
731
ESPN
9,444.0
YAHOO
9,947.6
ESPN/G
12.9
YAHOO/G
13.6

Fantasy points in ESPN’s and Yahoo’s default points leagues, worked out here from the season totals.

Fantasy by season
GP: Games the player appeared in, however briefly.ESPN: Fantasy points in ESPN’s default points scoring, worked out here from the season line.YAHOO: Fantasy points in Yahoo’s default points scoring, worked out here from the season line.ESPN/G: ESPN fantasy points per game played.YAHOO/G: Yahoo fantasy points per game played.
2003-04PHI53467.0555.58.810.5
2004-05PHI57669.0791.611.713.9
2005-06PHI1078.089.57.89.0
2006-07PHI741,109.01,270.615.017.2
2007-08PHI741,394.01,484.918.820.1
2008-09PHI811,205.01,207.214.914.9
2009-10PHI731,090.01,082.814.914.8
2010-11NO771,006.01,056.213.113.7
2011-12ATL53637.0614.012.011.6
2012-13LAC72791.0740.911.010.3
2013-14LAC55483.0506.68.89.2
2014-15ORL52515.0547.89.910.5

What the columns mean: GP · ESPN/G

Bio

Age
45 yearsJul 28, 1981
Height
6' 3"
Debut
2003
Birthplace
Detroit, MI
Draft
2003Rd 2, Pk 41

Latest performance

Willie Green

Apr 15 · @ BKN · L 101-88

MIN
22
PTS
5
REB
0
AST
2
STL
1
BLK
0
FG%
28.6
3PTM
1
Most recent games
DateOpponentPTSREBASTMIN
Wed, Apr 15atBKNL 101-8850222
Mon, Apr 13atMIAL 100-9354020
Sat, Apr 11vsNYL 80-79113025
Fri, Apr 10vsTORL 101-9951015
Sat, Apr 04atMILW 97-90100125
Fri, Apr 03atMINW 97-8452117

What were Willie Green's career stats?

Willie Green played 12 seasons for the 76ers, the Pelicans, the Hawks, the Clippers and the Magic. He scored 6,059 points with 1,303 rebounds and 1,018 assists in 731 games — 8.3 points, 1.8 rebounds and 1.4 assists per game. His best season was 2007-08: 921 points, 182 rebounds and 151 assists.

League leaderboards and awards

12 seasons, 7 postseasons, 2003-04 to 2014-15

Willie Green finished top 10 in a stat 2 times.

Season top 10 finishes

Among qualified NBA players each season, as the glossary defines each stat. All-time places are among players on file.

Willie Green college stats

Willie Green played 2 seasons at Detroit Mercy Titans (2001-02 to 2002-03): 18.2 points, 4.6 rebounds and 2.2 assists a game over 59 games.

Per game

Willie Green's college Per game by season
GP: Games the player appeared in, however briefly.GS: Games the player was in the starting five.MIN: Minutes on the floor.FG%: Share of shots from the floor that went in. League average sits near 47%.3P%: Share of three-point attempts that went in. League average sits near 36%.FT%: Share of free throws that went in. League average sits near 78%.OR: Rebounds grabbed at the offensive end, which hand the team a fresh possession.DR: Rebounds grabbed at the defensive end, which end the opponent's possession.REB: Missed shots the player collected, at either end of the floor.AST: Passes that led directly to a team-mate's basket.BLK: Opponent shots swatted away before they reached the rim.STL: Possessions taken off the opponent by picking off a pass or a dribble.PF: Fouls committed. Six in one game and the player is disqualified — lower is better.TO: Possessions handed to the opponent by a bad pass, a lost dribble or an offensive foul — lower is better.PTS: Points scored — a free throw is worth 1, a shot inside the arc 2, beyond it 3.
2001-02Detroit Mercy Titans292730.65.1-11.843.10.9-3.028.42.7-4.06713.24.21.90.30.82.62.213.7
2002-03Detroit Mercy Titans3030348.1-16.6491.2-3.337.45.1-6.380.51.13.94.92.50.41.32.42.322.6

Totals

Willie Green's college Totals by season
FG%: Share of shots from the floor that went in. League average sits near 47%.3P%: Share of three-point attempts that went in. League average sits near 36%.FT%: Share of free throws that went in. League average sits near 78%.OR: Rebounds grabbed at the offensive end, which hand the team a fresh possession.DR: Rebounds grabbed at the defensive end, which end the opponent's possession.REB: Missed shots the player collected, at either end of the floor.AST: Passes that led directly to a team-mate's basket.BLK: Opponent shots swatted away before they reached the rim.STL: Possessions taken off the opponent by picking off a pass or a dribble.PF: Fouls committed. Six in one game and the player is disqualified — lower is better.TO: Possessions handed to the opponent by a bad pass, a lost dribble or an offensive foul — lower is better.PTS: Points scored — a free throw is worth 1, a shot inside the arc 2, beyond it 3.
2001-02Detroit Mercy Titans147-34143.125-8828.477-115672993122559237563396
2002-03Detroit Mercy Titans244-4984937-9937.4153-19080.5321161487413407168678

More

Willie Green's college More by season
DD2: Games with double figures in two categories, most often points and rebounds.TD3: Games with double figures in three categories — points, rebounds and assists, usually.EJECT: Times the player was thrown out of a game.TECH: Technical fouls, called for conduct rather than contact: arguing, taunting, hanging on the rim.FLAG: Fouls the officials judged unnecessary or excessive contact; two in a game is an ejection.
2001-02Detroit Mercy Titans0010000.90.4-1.1610.47
2002-03Detroit Mercy Titans0020001.10.6-1.3610.53

College seasons as ESPN files them for the school he played for.

More on Willie Green

Playoff series

Willie Green played 36 games across 7 NBA postseasons in 8 series — 0 won, 8 lost.

Willie Green's line in each playoff series
PTS: Points scored — a free throw is worth 1, a shot inside the arc 2, beyond it 3.REB: Missed shots the player collected, at either end of the floor.AST: Passes that led directly to a team-mate's basket.
2013-14GSLost 1-230.71.30.0
2013-14OKCLost 1-121.51.50.5
2012-13MEMLost 1-232.01.00.7
2011-12BOSLost 2-352.61.60.6
2010-11LALLost 2-465.70.80.7
2008-09ORLLost 2-467.81.01.2
2007-08DETLost 2-469.01.32.0
2004-05DETLost 1-455.41.80.6

What the columns mean: PTS · REB · AST

Willie Green’s playoff series, round by round

Per game, from NBA game logs since the 1946-47 postseason — earlier series are not counted.