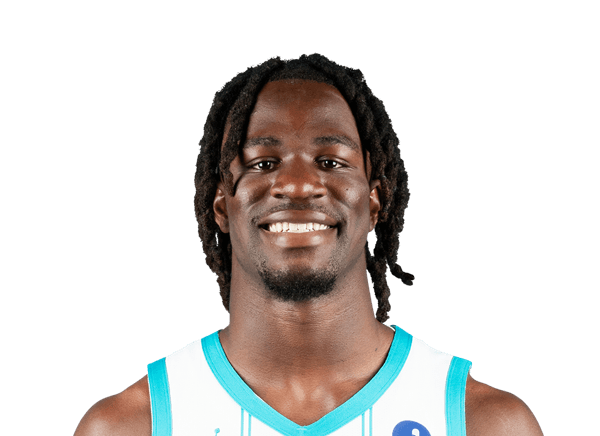
Sion James stats

Hornets

Guard · #4

Age 23 · 6' 5" · 220 lbs

Compare with…

Sion James averaged 5.8 points, 3.0 rebounds and 2.5 assists per game in 10 games of 2026-27 for the Charlotte Hornets. Last game: .

Stats

Choose how these numbers are shown

Per game

PTS
5.8
REB
3.0
AST
2.5
STL
0.7
BLK
0.0
TS%
44.0
MIN
24.8
GP
10
Per game by season
PTS: Points scored — a free throw is worth 1, a shot inside the arc 2, beyond it 3.REB: Missed shots the player collected, at either end of the floor.AST: Passes that led directly to a team-mate's basket.STL: Possessions taken off the opponent by picking off a pass or a dribble.BLK: Opponent shots swatted away before they reached the rim.TS%: Scoring per shot with threes and free throws counted: PTS ÷ (2 × (FGA + 0.44 × FTA)). League average sits near 58%.MIN: Minutes on the floor.GP: Games the player appeared in, however briefly.
2025-26CHA5.43.52.00.60.253.122.582
2026-27CHA5.83.02.50.70.044.024.810

What the columns mean: PTS · REB · AST · STL · BLK · TS% · MIN · GP

Career regular season

PTS
5.4
REB
3.4
AST
2.0
STL
0.6
BLK
0.2
TS%
51.9
MIN
22.7
GP
92

Totals

PTS
58
REB
30
AST
25
STL
7
BLK
0
TO
9
FGM
20
3PTM
11
Totals by season
PTS: Points scored — a free throw is worth 1, a shot inside the arc 2, beyond it 3.REB: Missed shots the player collected, at either end of the floor.AST: Passes that led directly to a team-mate's basket.STL: Possessions taken off the opponent by picking off a pass or a dribble.BLK: Opponent shots swatted away before they reached the rim.TO: Possessions handed to the opponent by a bad pass, a lost dribble or an offensive foul — lower is better.FGM: Shots made from the floor — everything except free throws.3PTM: Three-point shots made.
2025-26CHA44128716352206513883
2026-27CHA5830257092011

What the columns mean: PTS · REB · AST · STL · BLK · TO · FGM · 3PTM

Career regular season

PTS
499
REB
317
AST
188
STL
59
BLK
20
TO
74
FGM
158
3PTM
94

Per 36 min

PTS
8.4
REB
4.4
AST
3.6
STL
1.0
BLK
0.0
TS%
44.0
MIN
24.8
GP
10

Per 36 minutes: each per-game figure scaled by 36 ÷ minutes played. Derived here, and shooting percentages are left untouched because they do not scale.

Per 36 min by season
PTS: Points scored — a free throw is worth 1, a shot inside the arc 2, beyond it 3.REB: Missed shots the player collected, at either end of the floor.AST: Passes that led directly to a team-mate's basket.STL: Possessions taken off the opponent by picking off a pass or a dribble.BLK: Opponent shots swatted away before they reached the rim.TS%: Scoring per shot with threes and free throws counted: PTS ÷ (2 × (FGA + 0.44 × FTA)). League average sits near 58%.MIN: Minutes on the floor.GP: Games the player appeared in, however briefly.
2025-26CHA8.65.63.21.00.353.122.582
2026-27CHA8.44.43.61.00.044.024.810

What the columns mean: PTS · REB · AST · STL · BLK · TS% · MIN · GP

Career regular season, Per 36 min

PTS
8.6
REB
5.4
AST
3.2
STL
1.0
BLK
0.3
TS%
51.9
MIN
22.7
GP
92

Fantasy

GP
10
ESPN
135.0
YAHOO
143.5
ESPN/G
13.5
YAHOO/G
14.4

Fantasy points in ESPN’s and Yahoo’s default points leagues, worked out here from the season totals.

Fantasy by season
GP: Games the player appeared in, however briefly.ESPN: Fantasy points in ESPN’s default points scoring, worked out here from the season line.YAHOO: Fantasy points in Yahoo’s default points scoring, worked out here from the season line.ESPN/G: ESPN fantasy points per game played.YAHOO/G: Yahoo fantasy points per game played.
2025-26CHA821,183.01,180.914.414.4
2026-27CHA10135.0143.513.514.4

What the columns mean: GP · ESPN/G

Career regular season

GP
92
ESPN
1,318.0
YAHOO
1,324.4
ESPN/G
14.3
YAHOO/G
14.4

Bio

Age
23 yearsDec 4, 2002
Height
6' 5"
Weight
220 lbs
Experience
2 years
Birthplace
Sugar Hill, GA
Draft
2025Rd 2, Pk 33
College
Duke
Salary
$2.41 million2026-27

Latest performance

Sion James

Nov 09 · vs CLE · W 124-112

MIN
33
PTS
11
REB
4
AST
4
STL
2
BLK
0
FG%
44.4
3PTM
3

Next

at PHXThu, Nov 12

vs PHX since 2026

2
GP
10
PTS
7
REB
2
AST
37
MIN
Most recent games
DateOpponentPTSREBASTMIN
Mon, Nov 09vsCLEW 124-112114433
Fri, Nov 06vsBOSL 119-80113021
Wed, Nov 04atBKNL 114-104102131
Mon, Nov 02vsDETL 124-91114321
Sat, Oct 31vsPHIL 109-10442118
Fri, Oct 30atWSHL 95-7965429

What are Sion James's career stats?

Sion James has played 2 seasons for the Hornets. He has scored 499 points with 317 rebounds and 188 assists in 92 games — 5.4 points, 3.4 rebounds and 2.0 assists per game. His best season so far is 2025-26: 441 points, 287 rebounds and 163 assists.

Best single games

  • Points: 15 vs UTAH on Nov 2, 2025, W 126-103
  • Rebounds: 8 vs DAL on Mar 3, 2026, W 117-90
  • Assists: 7 vs CLE on Feb 20, 2026, L 118-113
  • Steals: 5 @ MIL on Nov 14, 2025, L 147-134 OT
  • Blocks: 2 @ OKC on Jan 5, 2026, W 124-97
  • 3-Pointers Made: 4 vs IND on Apr 3, 2026, W 129-108
Sion James's best game in each stat, by season
SeasonPTSPTS: Points scored — a free throw is worth 1, a shot inside the arc 2, beyond it 3.REBREB: Missed shots the player collected, at either end of the floor.ASTAST: Passes that led directly to a team-mate's basket.STLSTL: Possessions taken off the opponent by picking off a pass or a dribble.BLKBLK: Opponent shots swatted away before they reached the rim.3PTM3PTM: Three-point shots made.TOTO: Possessions handed to the opponent by a bad pass, a lost dribble or an offensive foul — lower is better.
2025-2615875244

What the columns mean: PTS · REB · AST · STL · BLK · 3PTM · TO

Regular season only, from NBA game logs since 2025-26.

Sion James college stats

Sion James played 5 seasons at Tulane Green Wave and Duke Blue Devils (2020-21 to 2024-25): 9.3 points, 4.5 rebounds and 3.0 assists a game over 153 games.

Per game

Sion James's college Per game by season
GP: Games the player appeared in, however briefly.GS: Games the player was in the starting five.MIN: Minutes on the floor.FG%: Share of shots from the floor that went in. League average sits near 47%.3P%: Share of three-point attempts that went in. League average sits near 36%.FT%: Share of free throws that went in. League average sits near 78%.OR: Rebounds grabbed at the offensive end, which hand the team a fresh possession.DR: Rebounds grabbed at the defensive end, which end the opponent's possession.REB: Missed shots the player collected, at either end of the floor.AST: Passes that led directly to a team-mate's basket.BLK: Opponent shots swatted away before they reached the rim.STL: Possessions taken off the opponent by picking off a pass or a dribble.PF: Fouls committed. Six in one game and the player is disqualified — lower is better.TO: Possessions handed to the opponent by a bad pass, a lost dribble or an offensive foul — lower is better.PTS: Points scored — a free throw is worth 1, a shot inside the arc 2, beyond it 3.
2020-21Tulane Green Wave2317261.9-4.443.10.3-1.1281.7-2.6650.533.51.90.21.22.21.75.8
2021-22Tulane Green Wave292835.22.5-6.140.90.7-2.033.31.8-2.670.30.43.84.33.60.51.62.41.67.4
2022-23Tulane Green Wave313137.33.3-6.848.30.8-2.631.72.3-3.2710.74.14.83.40.822.91.29.7
2023-24Tulane Green Wave313036.84.8-9.351.41.4-3.638.13.1-4.568.314.45.42.70.71.62.61.214
2024-25Duke Blue Devils393225.52.9-5.651.60.8-1.941.32.1-2.6810.73.44.22.90.30.821.28.6

Totals

Sion James's college Totals by season
FG%: Share of shots from the floor that went in. League average sits near 47%.3P%: Share of three-point attempts that went in. League average sits near 36%.FT%: Share of free throws that went in. League average sits near 78%.OR: Rebounds grabbed at the offensive end, which hand the team a fresh possession.DR: Rebounds grabbed at the defensive end, which end the opponent's possession.REB: Missed shots the player collected, at either end of the floor.AST: Passes that led directly to a team-mate's basket.BLK: Opponent shots swatted away before they reached the rim.STL: Possessions taken off the opponent by picking off a pass or a dribble.PF: Fouls committed. Six in one game and the player is disqualified — lower is better.TO: Possessions handed to the opponent by a bad pass, a lost dribble or an offensive foul — lower is better.PTS: Points scored — a free throw is worth 1, a shot inside the arc 2, beyond it 3.
2020-21Tulane Green Wave44-10243.17-252839-6065117081445285139134
2021-22Tulane Green Wave72-17640.919-5733.352-7470.31311112410414467046215
2022-23Tulane Green Wave102-21148.326-8231.771-100712112814910525639038301
2023-24Tulane Green Wave148-28851.443-11338.195-13968.3301361668423508137434
2024-25Duke Blue Devils112-21751.631-7541.381-100812913416311510327947336

More

Sion James's college More by season
DD2: Games with double figures in two categories, most often points and rebounds.TD3: Games with double figures in three categories — points, rebounds and assists, usually.EJECT: Times the player was thrown out of a game.TECH: Technical fouls, called for conduct rather than contact: arguing, taunting, hanging on the rim.FLAG: Fouls the officials judged unnecessary or excessive contact; two in a game is an ejection.
2020-21Tulane Green Wave0020001.10.7-1.3140.47
2021-22Tulane Green Wave0020002.31-1.2220.46
2022-23Tulane Green Wave0030102.81.7-1.4270.55
2023-24Tulane Green Wave1020102.31.4-1.5070.59
2024-25Duke Blue Devils1000002.40.7-1.5480.59

College seasons as ESPN files them for the school he played for.

More on Sion James