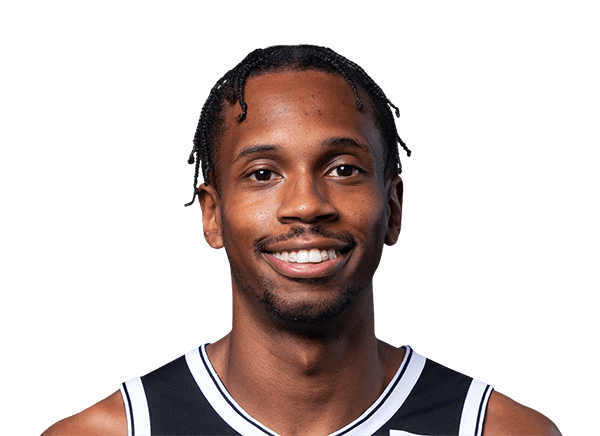
Lance Thomas stats
Bio
- Age
- 38 yearsApr 24, 1988
- Height
- 6' 8"
Lance Thomas played 9 NBA seasons, 2011-12 to 2019-20.
Stats
Per game
Career regular season
- PTS
- 5.1
- REB
- 2.6
- AST
- 0.7
- STL
- 0.4
- BLK
- 0.1
- TS%
- 51.0
- MIN
- 18.4
- GP
- 399
| PTS: Points scored — a free throw is worth 1, a shot inside the arc 2, beyond it 3. | REB: Missed shots the player collected, at either end of the floor. | AST: Passes that led directly to a team-mate's basket. | STL: Possessions taken off the opponent by picking off a pass or a dribble. | BLK: Opponent shots swatted away before they reached the rim. | TS%: Scoring per shot with threes and free throws counted: PTS ÷ (2 × (FGA + 0.44 × FTA)). League average sits near 58%. | MIN: Minutes on the floor. | GP: Games the player appeared in, however briefly. | ||
|---|---|---|---|---|---|---|---|---|---|
| 2011-12 | NO | 4.0 | 3.0 | 0.3 | 0.2 | 0.2 | 54.1 | 15.0 | 42 |
| 2012-13 | NO | 2.5 | 1.9 | 0.3 | 0.2 | 0.1 | 56.5 | 10.9 | 59 |
| 2013-14 | NO | 1.2 | 1.4 | 0.6 | 0.0 | 0.0 | 27.9 | 8.4 | 5 |
| 2014-15 |  OKC/NY | 7.1 | 3.1 | 1.1 | 0.6 | 0.1 | 45.6 | 24.0 | 62 |
| 2015-16 | NY | 8.2 | 2.2 | 0.9 | 0.4 | 0.1 | 55.7 | 22.3 | 59 |
| 2016-17 | NY | 6.0 | 3.1 | 0.8 | 0.5 | 0.1 | 51.6 | 21.0 | 46 |
| 2017-18 | NY | 4.1 | 2.4 | 0.6 | 0.4 | 0.2 | 51.3 | 18.5 | 73 |
| 2018-19 | NY | 4.5 | 2.5 | 0.6 | 0.4 | 0.2 | 48.2 | 17.0 | 46 |
| 2019-20 | BKN | 3.4 | 1.9 | 0.9 | 0.0 | 0.0 | 48.5 | 14.0 | 7 |
What the columns mean: PTS · REB · AST · STL · BLK · TS% · MIN · GP
Career Postseason
- PTS
- 1.3
- REB
- 1.0
- AST
- 0.0
- STL
- 0.0
- BLK
- 0.3
- TS%
- 29.6
- MIN
- 5.7
- GP
- 3
Totals
Career regular season
- PTS
- 2,050
- REB
- 1,021
- AST
- 266
- STL
- 148
- BLK
- 55
- TO
- 267
- FGM
- 748
- 3PTM
- 165
| PTS: Points scored — a free throw is worth 1, a shot inside the arc 2, beyond it 3. | REB: Missed shots the player collected, at either end of the floor. | AST: Passes that led directly to a team-mate's basket. | STL: Possessions taken off the opponent by picking off a pass or a dribble. | BLK: Opponent shots swatted away before they reached the rim. | TO: Possessions handed to the opponent by a bad pass, a lost dribble or an offensive foul — lower is better. | FGM: Shots made from the floor — everything except free throws. | 3PTM: Three-point shots made. | ||
|---|---|---|---|---|---|---|---|---|---|
| 2011-12 | NO | 166 | 126 | 12 | 10 | 7 | 24 | 57 | 0 |
| 2012-13 | NO | 149 | 115 | 17 | 11 | 7 | 14 | 53 | 0 |
| 2013-14 | NO | 6 | 7 | 3 | 0 | 0 | 2 | 2 | 0 |
| 2014-15 | OKC/NY | 443 | 195 | 69 | 37 | 8 | 74 | 182 | 7 |
| 2015-16 | NY | 484 | 131 | 53 | 22 | 7 | 57 | 169 | 44 |
| 2016-17 | NY | 275 | 142 | 35 | 21 | 5 | 25 | 97 | 38 |
| 2017-18 | NY | 298 | 175 | 44 | 30 | 14 | 41 | 102 | 50 |
| 2018-19 | NY | 205 | 117 | 27 | 17 | 7 | 24 | 78 | 22 |
| 2019-20 | BKN | 24 | 13 | 6 | 0 | 0 | 6 | 8 | 4 |
What the columns mean: PTS · REB · AST · STL · BLK · TO · FGM · 3PTM
Per 36 min
Career regular season
- PTS
- 10.0
- REB
- 5.1
- AST
- 1.4
- STL
- 0.8
- BLK
- 0.2
- TS%
- 51.0
- MIN
- 18.4
- GP
- 399
Per 36 minutes: each per-game figure scaled by 36 ÷ minutes played. Derived here, and shooting percentages are left untouched because they do not scale.
| PTS: Points scored — a free throw is worth 1, a shot inside the arc 2, beyond it 3. | REB: Missed shots the player collected, at either end of the floor. | AST: Passes that led directly to a team-mate's basket. | STL: Possessions taken off the opponent by picking off a pass or a dribble. | BLK: Opponent shots swatted away before they reached the rim. | TS%: Scoring per shot with threes and free throws counted: PTS ÷ (2 × (FGA + 0.44 × FTA)). League average sits near 58%. | MIN: Minutes on the floor. | GP: Games the player appeared in, however briefly. | ||
|---|---|---|---|---|---|---|---|---|---|
| 2011-12 | NO | 9.6 | 7.2 | 0.7 | 0.5 | 0.5 | 54.1 | 15.0 | 42 |
| 2012-13 | NO | 8.3 | 6.3 | 1.0 | 0.7 | 0.3 | 56.5 | 10.9 | 59 |
| 2013-14 | NO | 5.1 | 6.0 | 2.6 | 0.0 | 0.0 | 27.9 | 8.4 | 5 |
| 2014-15 | OKC/NY | 10.7 | 4.7 | 1.7 | 0.9 | 0.2 | 45.6 | 24.0 | 62 |
| 2015-16 | NY | 13.2 | 3.6 | 1.5 | 0.6 | 0.2 | 55.7 | 22.3 | 59 |
| 2016-17 | NY | 10.3 | 5.3 | 1.4 | 0.9 | 0.2 | 51.6 | 21.0 | 46 |
| 2017-18 | NY | 8.0 | 4.7 | 1.2 | 0.8 | 0.4 | 51.3 | 18.5 | 73 |
| 2018-19 | NY | 9.5 | 5.3 | 1.3 | 0.8 | 0.4 | 48.2 | 17.0 | 46 |
| 2019-20 | BKN | 8.7 | 4.9 | 2.3 | 0.0 | 0.0 | 48.5 | 14.0 | 7 |
What the columns mean: PTS · REB · AST · STL · BLK · TS% · MIN · GP
Fantasy
Career regular season
- GP
- 399
- ESPN
- 3,648.0
- YAHOO
- 4,016.2
- ESPN/G
- 9.1
- YAHOO/G
- 10.1
Fantasy points in ESPN’s and Yahoo’s default points leagues, worked out here from the season totals.
| GP: Games the player appeared in, however briefly. | ESPN: Fantasy points in ESPN’s default points scoring, worked out here from the season line. | YAHOO: Fantasy points in Yahoo’s default points scoring, worked out here from the season line. | ESPN/G: ESPN fantasy points per game played. | YAHOO/G: Yahoo fantasy points per game played. | ||
|---|---|---|---|---|---|---|
| 2011-12 | NO | 42 | 314.0 | 362.2 | 7.5 | 8.6 |
| 2012-13 | NO | 59 | 326.0 | 352.5 | 5.5 | 6.0 |
| 2013-14 | NO | 5 | 8.0 | 16.9 | 1.6 | 3.4 |
| 2014-15 | OKC/NY | 62 | 710.0 | 841.5 | 11.5 | 13.6 |
| 2015-16 | NY | 59 | 706.0 | 750.7 | 12.0 | 12.7 |
| 2016-17 | NY | 46 | 521.0 | 550.9 | 11.3 | 12.0 |
| 2017-18 | NY | 73 | 633.0 | 665.0 | 8.7 | 9.1 |
| 2018-19 | NY | 46 | 396.0 | 433.9 | 8.6 | 9.4 |
| 2019-20 | BKN | 7 | 34.0 | 42.6 | 4.9 | 6.1 |
Bio
- Age
- 38 yearsApr 24, 1988
- Height
- 6' 8"
- Debut
- 2011
- Birthplace
- Brooklyn, NY
- College
- Duke
Latest performance

Lance Thomas
Aug 23 · vs TOR · L 150-122
- MIN
- 7
- PTS
- 4
- REB
- 3
- AST
- 0
- STL
- 0
- BLK
- 0
- FG%
- 50.0
- 3PTM
- 0
Games
All games| Date | Opponent | PTS | REB | AST | MIN |
|---|---|---|---|---|---|
| Sun, Aug 23 | vs TORL 150-122 | 4 | 3 | 0 | 7 |
| Fri, Aug 21 | vsTORL 117-92 | 0 | 0 | 0 | 6 |
| Mon, Aug 17 | atTORL 134-110 | 0 | 0 | 0 | 4 |
| Thu, Aug 13 | vs PORL 134-133 | 0 | 1 | 0 | 4 |
| Tue, Aug 11 | at ORLW 108-96 | 12 | 3 | 1 | 24 |
| Fri, Aug 07 | vs SACW 119-106 | 0 | 0 | 0 | 2 |
What were Lance Thomas's career stats?
Lance Thomas played 9 seasons for the Pelicans, the Knicks and the Nets. He scored 2,050 points with 1,021 rebounds and 266 assists in 399 games — 5.1 points, 2.6 rebounds and 0.7 assists per game. His best season was 2015-16: 484 points, 131 rebounds and 53 assists.
Lance Thomas college stats
Lance Thomas played 4 seasons at Duke Blue Devils (2006-07 to 2009-10): 4.6 points, 3.6 rebounds and 0.5 assists a game over 140 games.
Per game
Totals
More
College seasons as ESPN files them for the school he played for.
More on Lance Thomas
Playoff series
Lance Thomas played 3 games across 1 NBA postseason in one series — 0 won, 1 lost.
| Season | Opp | Series | G | PTSPTS: Points scored — a free throw is worth 1, a shot inside the arc 2, beyond it 3. | REBREB: Missed shots the player collected, at either end of the floor. | ASTAST: Passes that led directly to a team-mate's basket. |
|---|---|---|---|---|---|---|
| 2019-20 | TOR | Lost 0-3 | 3 | 1.3 | 1.0 | 0.0 |
Per game, from NBA game logs since the 1946-47 postseason — earlier series are not counted.
Lance Thomas against each club
- vs Brooklyn Nets (26)
- vs Boston Celtics (21)
- vs Toronto Raptors (21)
- vs Milwaukee Bucks (20)
- vs Orlando Magic (20)
- vs Houston Rockets (19)
- vs Indiana Pacers (19)
- vs Philadelphia 76ers (18)
- vs Washington Wizards (17)
- vs Charlotte Hornets (16)
- vs Miami Heat (16)
- vs Golden State Warriors (15)
- vs Cleveland Cavaliers (14)
- vs Los Angeles Lakers (14)
- vs Sacramento Kings (14)
- vs Atlanta Hawks (13)
- vs Chicago Bulls (13)
- vs Detroit Pistons (13)
- vs Memphis Grizzlies (13)
- vs San Antonio Spurs (13)
- vs Utah Jazz (13)
- vs Dallas Mavericks (12)
- vs LA Clippers (12)
- vs Minnesota Timberwolves (12)
- vs Portland Trail Blazers (12)
- vs Phoenix Suns (11)
- vs Denver Nuggets (10)
- vs Oklahoma City Thunder (10)
- vs New Orleans Pelicans (9)
- vs New York Knicks (4)
Similar players
Closest career per-game profiles to Lance Thomas among NBA players at the same position.
- Quincy PondexterAlike in Blocks, Assists82out of 100 on profile similarity
- Gary ForbesAlike in 3-Pointers Made, Blocks81out of 100 on profile similarity
- D.J. WilsonAlike in Assists, Points73out of 100 on profile similarity
- Andrew NicholsonAlike in 3-Pointers Made, Points70out of 100 on profile similarity
- Quincy AcyAlike in Assists, Points69out of 100 on profile similarity


Compare Lance Thomas with Quincy Pondexter, Gary Forbes, D.J. Wilson