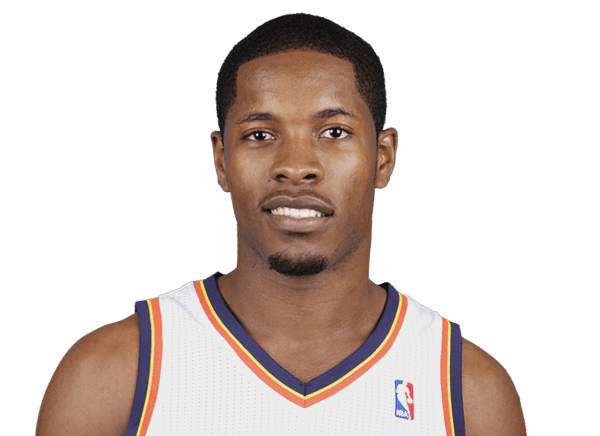
Jerome Dyson stats

Last played for the New Orleans Pelicans, 2011-12

Point Guard · #11

Age 39 · 6' 3"

Compare with…

Jerome Dyson played 1 NBA season, 2011-12 to 2011-12.

Stats

Choose how these numbers are shown

Per game

Career regular season

PTS
7.4
REB
2.1
AST
2.0
STL
1.2
BLK
0.2
TS%
52.5
MIN
20
GP
9
Per game by season
SeasonTeamPTSPTS: Points scored — a free throw is worth 1, a shot inside the arc 2, beyond it 3.REBREB: Missed shots the player collected, at either end of the floor.ASTAST: Passes that led directly to a team-mate's basket.STLSTL: Possessions taken off the opponent by picking off a pass or a dribble.BLKBLK: Opponent shots swatted away before they reached the rim.TS%TS%: Scoring per shot with threes and free throws counted: PTS ÷ (2 × (FGA + 0.44 × FTA)). League average sits near 58%.MINMIN: Minutes on the floor.GPGP: Games the player appeared in, however briefly.
2011-12NO7.42.12.01.20.252.5209

What the columns mean: PTS · REB · AST · STL · BLK · TS% · MIN · GP

Totals

Career regular season

PTS
67
REB
19
AST
18
STL
11
BLK
2
TO
20
FGM
19
3PTM
1
Totals by season
SeasonTeamPTSPTS: Points scored — a free throw is worth 1, a shot inside the arc 2, beyond it 3.REBREB: Missed shots the player collected, at either end of the floor.ASTAST: Passes that led directly to a team-mate's basket.STLSTL: Possessions taken off the opponent by picking off a pass or a dribble.BLKBLK: Opponent shots swatted away before they reached the rim.TOTO: Possessions handed to the opponent by a bad pass, a lost dribble or an offensive foul — lower is better.FGMFGM: Shots made from the floor — everything except free throws.3PTM3PTM: Three-point shots made.
2011-12NO67191811220191

What the columns mean: PTS · REB · AST · STL · BLK · TO · FGM · 3PTM

Per 36 min

Career regular season

PTS
13.3
REB
3.8
AST
3.6
STL
2.2
BLK
0.4
TS%
52.5
MIN
20
GP
9

Per 36 minutes: each per-game figure scaled by 36 ÷ minutes played. Derived here, and shooting percentages are left untouched because they do not scale.

Per 36 min by season
SeasonTeamPTSPTS: Points scored — a free throw is worth 1, a shot inside the arc 2, beyond it 3.REBREB: Missed shots the player collected, at either end of the floor.ASTAST: Passes that led directly to a team-mate's basket.STLSTL: Possessions taken off the opponent by picking off a pass or a dribble.BLKBLK: Opponent shots swatted away before they reached the rim.TS%TS%: Scoring per shot with threes and free throws counted: PTS ÷ (2 × (FGA + 0.44 × FTA)). League average sits near 58%.MINMIN: Minutes on the floor.GPGP: Games the player appeared in, however briefly.
2011-12NO13.33.83.62.20.452.5209

What the columns mean: PTS · REB · AST · STL · BLK · TS% · MIN · GP

Fantasy

Career regular season

GP
9
ESPN
117.0
YAHOO
135.8
ESPN/G
13.0
YAHOO/G
15.1

Fantasy points in ESPN’s and Yahoo’s default points leagues, worked out here from the season totals.

Fantasy by season
SeasonTeamGPGP: Games the player appeared in, however briefly.ESPNESPN: Fantasy points in ESPN’s default points scoring, worked out here from the season line.YAHOOYAHOO: Fantasy points in Yahoo’s default points scoring, worked out here from the season line.ESPN/GESPN/G: ESPN fantasy points per game played.YAHOO/GYAHOO/G: Yahoo fantasy points per game played.
2011-12NO9117.0135.813.015.1

What the columns mean: GP · ESPN/G

Bio

Age
39 yearsMay 1, 1987
Height
6' 3"
Debut
2011
Birthplace
Rockville, MD
College
UConn

Latest performance

Jerome Dyson

Apr 26 · @ HOU · L 84-77

MIN
41
PTS
15
REB
2
AST
1
STL
3
BLK
1
FG%
42.9
3PTM
0
Most recent games
DateOpponentPTSREBASTMIN
Thu, Apr 26atHOUL 84-77152141
Tue, Apr 24atGSW 83-8151325
Sun, Apr 22atLACL 107-9872318
Thu, Apr 19vsHOUW 105-99 OT04113
Wed, Apr 18atMEML 103-91243227
Mon, Apr 16atCHAW 75-6793015

What were Jerome Dyson's career stats?

Jerome Dyson played 1 season for the Pelicans. He scored 67 points with 19 rebounds and 18 assists in 9 games — 7.4 points, 2.1 rebounds and 2.0 assists per game. His best season was 2011-12: 67 points, 19 rebounds and 18 assists.

Jerome Dyson college stats

Jerome Dyson played 4 seasons at UConn Huskies (2006-07 to 2009-10): 14.4 points, 3.9 rebounds and 2.9 assists a game over 113 games.

Per game

Jerome Dyson's college Per game by season
GP: Games the player appeared in, however briefly.GS: Games the player was in the starting five.MIN: Minutes on the floor.FG%: Share of shots from the floor that went in. League average sits near 47%.3P%: Share of three-point attempts that went in. League average sits near 36%.FT%: Share of free throws that went in. League average sits near 78%.OR: Rebounds grabbed at the offensive end, which hand the team a fresh possession.DR: Rebounds grabbed at the defensive end, which end the opponent's possession.REB: Missed shots the player collected, at either end of the floor.AST: Passes that led directly to a team-mate's basket.BLK: Opponent shots swatted away before they reached the rim.STL: Possessions taken off the opponent by picking off a pass or a dribble.PF: Fouls committed. Six in one game and the player is disqualified — lower is better.TO: Possessions handed to the opponent by a bad pass, a lost dribble or an offensive foul — lower is better.PTS: Points scored — a free throw is worth 1, a shot inside the arc 2, beyond it 3.
2006-07UConn Huskies313030.44.2-11.736.11.4-4.432.64.0-5.571.91.22.53.62.10.41.92.62.113.8
2007-08UConn Huskies2418273.9-9.441.31.1-3.532.53.6-4.481.11.12.53.620.71.832.712.5
2008-09UConn Huskies242429.34.3-10.640.81.0-2.934.83.5-4.872.41.32.84.13.20.31.81.8213.2
2009-10UConn Huskies343433.65.7-14.739.11.2-4.029.24.6-6.471.613.34.34.20.61.32.83.917.2

Totals

Jerome Dyson's college Totals by season
FG%: Share of shots from the floor that went in. League average sits near 47%.3P%: Share of three-point attempts that went in. League average sits near 36%.FT%: Share of free throws that went in. League average sits near 78%.OR: Rebounds grabbed at the offensive end, which hand the team a fresh possession.DR: Rebounds grabbed at the defensive end, which end the opponent's possession.REB: Missed shots the player collected, at either end of the floor.AST: Passes that led directly to a team-mate's basket.BLK: Opponent shots swatted away before they reached the rim.STL: Possessions taken off the opponent by picking off a pass or a dribble.PF: Fouls committed. Six in one game and the player is disqualified — lower is better.TO: Possessions handed to the opponent by a bad pass, a lost dribble or an offensive foul — lower is better.PTS: Points scored — a free throw is worth 1, a shot inside the arc 2, beyond it 3.
2006-07UConn Huskies131-36336.144-13532.6123-17171.936771136511588066429
2007-08UConn Huskies93-22541.327-8332.586-10681.12660864816427165299
2008-09UConn Huskies104-25540.824-6934.884-11672.4306898768444349316
2009-10UConn Huskies195-49939.140-13729.2156-21871.633113146144214495132586

More

Jerome Dyson's college More by season
DD2: Games with double figures in two categories, most often points and rebounds.TD3: Games with double figures in three categories — points, rebounds and assists, usually.EJECT: Times the player was thrown out of a game.TECH: Technical fouls, called for conduct rather than contact: arguing, taunting, hanging on the rim.FLAG: Fouls the officials judged unnecessary or excessive contact; two in a game is an ejection.
2006-07UConn Huskies00400010.9-1.1820.42
2007-08UConn Huskies0030300.70.6-1.3290.47
2008-09UConn Huskies0000001.60.9-1.2390.45
2009-10UConn Huskies0010001.10.3-1.1740.43

College seasons as ESPN files them for the school he played for.

More on Jerome Dyson