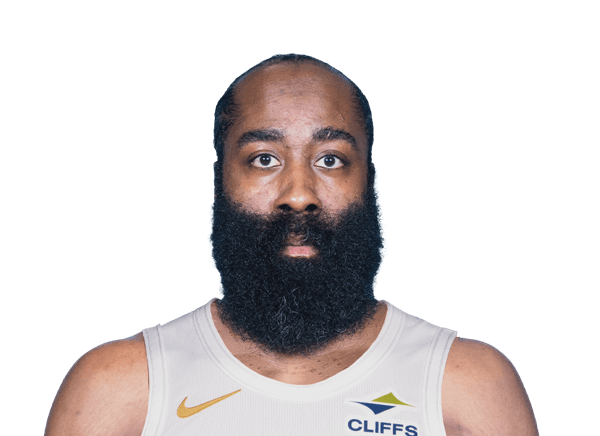
James Harden stats
CavaliersBio
- Age
- 37 yearsAug 26, 1989
- Height
- 6' 5"
- Weight
- 220 lbs
- MVP
- 2017-18

James Harden averaged 15.3 points, 4.8 rebounds and 5.7 assists per game in 11 games of 2026-27 for the Cleveland Cavaliers. Last game: .
Stats
Per game
- PTS
- 15.3
- REB
- 4.8
- AST
- 5.7
- STL
- 0.7
- BLK
- 0.5
- TS%
- 54.1
- MIN
- 32.6
- GP
- 11
Ranked among NBA players who qualify (PTS, REB, AST, STL, BLK: 20+ games; TS%: 20+ games, 5+ FGA) that season; only the top 50 are shown. How each stat qualifies: glossary.
| PTS: Points scored — a free throw is worth 1, a shot inside the arc 2, beyond it 3. | REB: Missed shots the player collected, at either end of the floor. | AST: Passes that led directly to a team-mate's basket. | STL: Possessions taken off the opponent by picking off a pass or a dribble. | BLK: Opponent shots swatted away before they reached the rim. | TS%: Scoring per shot with threes and free throws counted: PTS ÷ (2 × (FGA + 0.44 × FTA)). League average sits near 58%. | MIN: Minutes on the floor. | GP: Games the player appeared in, however briefly. | ||
|---|---|---|---|---|---|---|---|---|---|
| 2009-10 | OKC | 9.9 | 3.2 | 1.8 | 1.1 | 0.3 | 55.1 | 22.9 | 76 |
| 2010-11 | OKC | 12.2 | 3.1 | 2.1 | 1.1 | 0.3 | 59.8 | 26.7 | 82 |
| 2011-12 | OKC | 16.8 | 4.1 | 3.7 | 1.0 | 0.2 | 66.0 | 31.4 | 62 |
| 2012-13 | HOU | 25.9 | 4.9 | 5.8 | 1.8 | 0.5 | 60.0 | 38.3 | 78 |
| 2013-14 | HOU | 25.4 | 4.7 | 6.1 | 1.6 | 0.4 | 61.8 | 38.0 | 73 |
| 2014-15 | HOU | 27.4 | 5.7 | 7.0 | 1.9 | 0.7 | 60.5 | 36.8 | 81 |
| 2015-16 | HOU | 29.0 | 6.1 | 7.5 | 1.7 | 0.6 | 59.8 | 38.1 | 82 |
| 2016-17 | HOU | 29.1 | 8.1 | 11.2 | 1.5 | 0.5 | 61.3 | 36.4 | 81 |
| 2017-18 | HOU | 30.4 | 5.4 | 8.8 | 1.8 | 0.7 | 61.9 | 35.4 | 72 |
| 2018-19 | HOU | 36.1 | 6.6 | 7.5 | 2.0 | 0.7 | 61.6 | 36.8 | 78 |
| 2019-20 | HOU | 34.3 | 6.6 | 7.5 | 1.8 | 0.9 | 62.6 | 36.5 | 68 |
| 2020-21 |  HOU/BKN | 24.6 | 7.9 | 10.8 | 1.2 | 0.8 | 61.8 | 36.6 | 44 |
| 2021-22 |  BKN/PHI | 22.0 | 7.7 | 10.3 | 1.3 | 0.6 | 58.3 | 37.2 | 65 |
| 2022-23 | PHI | 21.0 | 6.1 | 10.7 | 1.2 | 0.5 | 60.7 | 36.8 | 58 |
| 2023-24 | LAC | 16.6 | 5.1 | 8.5 | 1.1 | 0.8 | 61.2 | 34.3 | 72 |
| 2024-25 | LAC | 22.8 | 5.8 | 8.7 | 1.5 | 0.7 | 58.2 | 35.3 | 79 |
| 2025-26 |  LAC/CLE | 23.6 | 4.8 | 8.0 | 1.1 | 0.4 | 61.0 | 34.8 | 70 |
| 2026-27 | CLE | 15.3 | 4.8 | 5.7 | 0.7 | 0.5 | 54.1 | 32.6 | 11 |
What the columns mean: PTS · REB · AST · STL · BLK · TS% · MIN · GP
Career regular season
- PTS
- 24.0
- REB
- 5.6
- AST
- 7.3
- STL
- 1.5
- BLK
- 0.6
- TS%
- 60.7
- MIN
- 34.7
- GP
- 1,232
Career Postseason
- PTS
- 22.2
- REB
- 5.4
- AST
- 6.4
- STL
- 1.6
- BLK
- 0.6
- TS%
- 58.4
- MIN
- 36.3
- GP
- 191
Totals
- PTS
- 168
- REB
- 53
- AST
- 63
- STL
- 8
- BLK
- 6
- TO
- 33
- FGM
- 48
- 3PTM
- 27
| PTS: Points scored — a free throw is worth 1, a shot inside the arc 2, beyond it 3. | REB: Missed shots the player collected, at either end of the floor. | AST: Passes that led directly to a team-mate's basket. | STL: Possessions taken off the opponent by picking off a pass or a dribble. | BLK: Opponent shots swatted away before they reached the rim. | TO: Possessions handed to the opponent by a bad pass, a lost dribble or an offensive foul — lower is better. | FGM: Shots made from the floor — everything except free throws. | 3PTM: Three-point shots made. | ||
|---|---|---|---|---|---|---|---|---|---|
| 2009-10 | OKC | 753 | 244 | 137 | 80 | 20 | 106 | 233 | 93 |
| 2010-11 | OKC | 998 | 255 | 176 | 92 | 24 | 106 | 298 | 113 |
| 2011-12 | OKC | 1,044 | 252 | 229 | 62 | 15 | 137 | 309 | 114 |
| 2012-13 | HOU | 2,023 | 379 | 455 | 142 | 38 | 295 | 585 | 179 |
| 2013-14 | HOU | 1,851 | 344 | 446 | 115 | 29 | 265 | 549 | 177 |
| 2014-15 | HOU | 2,217 | 459 | 565 | 154 | 60 | 321 | 647 | 208 |
| 2015-16 | HOU | 2,376 | 501 | 612 | 139 | 51 | 374 | 710 | 236 |
| 2016-17 | HOU | 2,356 | 659 | 907 | 121 | 38 | 464 | 674 | 262 |
| 2017-18 | HOU | 2,191 | 389 | 630 | 126 | 50 | 315 | 651 | 265 |
| 2018-19 | HOU | 2,818 | 518 | 586 | 158 | 58 | 387 | 843 | 378 |
| 2019-20 | HOU | 2,335 | 446 | 512 | 125 | 60 | 308 | 672 | 299 |
| 2020-21 | HOU/BKN | 1,083 | 348 | 475 | 53 | 33 | 177 | 342 | 121 |
| 2021-22 | BKN/PHI | 1,432 | 500 | 667 | 82 | 36 | 284 | 407 | 148 |
| 2022-23 | PHI | 1,216 | 354 | 618 | 71 | 31 | 195 | 371 | 161 |
| 2023-24 | LAC | 1,192 | 369 | 614 | 77 | 57 | 185 | 352 | 186 |
| 2024-25 | LAC | 1,802 | 456 | 687 | 118 | 55 | 341 | 531 | 235 |
| 2025-26 | LAC/CLE | 1,652 | 336 | 557 | 79 | 28 | 245 | 487 | 215 |
| 2026-27 | CLE | 168 | 53 | 63 | 8 | 6 | 33 | 48 | 27 |
What the columns mean: PTS · REB · AST · STL · BLK · TO · FGM · 3PTM
Career regular season
- PTS
- 29,507
- REB
- 6,862
- AST
- 8,936
- STL
- 1,802
- BLK
- 689
- TO
- 4,538
- FGM
- 8,709
- 3PTM
- 3,417
Per 36 min
- PTS
- 16.9
- REB
- 5.3
- AST
- 6.3
- STL
- 0.8
- BLK
- 0.6
- TS%
- 54.1
- MIN
- 32.6
- GP
- 11
Per 36 minutes: each per-game figure scaled by 36 ÷ minutes played. Derived here, and shooting percentages are left untouched because they do not scale.
| PTS: Points scored — a free throw is worth 1, a shot inside the arc 2, beyond it 3. | REB: Missed shots the player collected, at either end of the floor. | AST: Passes that led directly to a team-mate's basket. | STL: Possessions taken off the opponent by picking off a pass or a dribble. | BLK: Opponent shots swatted away before they reached the rim. | TS%: Scoring per shot with threes and free throws counted: PTS ÷ (2 × (FGA + 0.44 × FTA)). League average sits near 58%. | MIN: Minutes on the floor. | GP: Games the player appeared in, however briefly. | ||
|---|---|---|---|---|---|---|---|---|---|
| 2009-10 | OKC | 15.6 | 5.0 | 2.8 | 1.7 | 0.5 | 55.1 | 22.9 | 76 |
| 2010-11 | OKC | 16.4 | 4.2 | 2.8 | 1.5 | 0.4 | 59.8 | 26.7 | 82 |
| 2011-12 | OKC | 19.3 | 4.7 | 4.2 | 1.1 | 0.2 | 66.0 | 31.4 | 62 |
| 2012-13 | HOU | 24.3 | 4.6 | 5.5 | 1.7 | 0.5 | 60.0 | 38.3 | 78 |
| 2013-14 | HOU | 24.1 | 4.5 | 5.8 | 1.5 | 0.4 | 61.8 | 38.0 | 73 |
| 2014-15 | HOU | 26.8 | 5.6 | 6.8 | 1.9 | 0.7 | 60.5 | 36.8 | 81 |
| 2015-16 | HOU | 27.4 | 5.8 | 7.1 | 1.6 | 0.6 | 59.8 | 38.1 | 82 |
| 2016-17 | HOU | 28.8 | 8.0 | 11.1 | 1.5 | 0.5 | 61.3 | 36.4 | 81 |
| 2017-18 | HOU | 30.9 | 5.5 | 8.9 | 1.8 | 0.7 | 61.9 | 35.4 | 72 |
| 2018-19 | HOU | 35.3 | 6.5 | 7.3 | 2.0 | 0.7 | 61.6 | 36.8 | 78 |
| 2019-20 | HOU | 33.8 | 6.5 | 7.4 | 1.8 | 0.9 | 62.6 | 36.5 | 68 |
| 2020-21 | HOU/BKN | 24.2 | 7.8 | 10.6 | 1.2 | 0.8 | 61.8 | 36.6 | 44 |
| 2021-22 | BKN/PHI | 21.3 | 7.5 | 10.0 | 1.3 | 0.6 | 58.3 | 37.2 | 65 |
| 2022-23 | PHI | 20.5 | 6.0 | 10.5 | 1.2 | 0.5 | 60.7 | 36.8 | 58 |
| 2023-24 | LAC | 17.4 | 5.4 | 8.9 | 1.2 | 0.8 | 61.2 | 34.3 | 72 |
| 2024-25 | LAC | 23.3 | 5.9 | 8.9 | 1.5 | 0.7 | 58.2 | 35.3 | 79 |
| 2025-26 | LAC/CLE | 24.4 | 5.0 | 8.3 | 1.1 | 0.4 | 61.0 | 34.8 | 70 |
| 2026-27 | CLE | 16.9 | 5.3 | 6.3 | 0.8 | 0.6 | 54.1 | 32.6 | 11 |
What the columns mean: PTS · REB · AST · STL · BLK · TS% · MIN · GP
Career regular season, Per 36 min
- PTS
- 24.9
- REB
- 5.8
- AST
- 7.6
- STL
- 1.6
- BLK
- 0.6
- TS%
- 60.7
- MIN
- 34.7
- GP
- 1,232
Fantasy
- GP
- 11
- ESPN
- 320.0
- YAHOO
- 335.1
- ESPN/G
- 29.1
- YAHOO/G
- 30.5
Fantasy points in ESPN’s and Yahoo’s default points leagues, worked out here from the season totals.
Ranked among NBA players with 20+ games that season; only the top 50 are shown. How each stat qualifies: glossary.
| GP: Games the player appeared in, however briefly. | ESPN: Fantasy points in ESPN’s default points scoring, worked out here from the season line. | YAHOO: Fantasy points in Yahoo’s default points scoring, worked out here from the season line. | ESPN/G: ESPN fantasy points per game played. | YAHOO/G: Yahoo fantasy points per game played. | ||
|---|---|---|---|---|---|---|
| 2009-10 | OKC | 76 | 1,394.0 | 1,445.3 | 18.3 | 19.0 |
| 2010-11 | OKC | 82 | 1,828.0 | 1,810.0 | 22.3 | 22.1 |
| 2011-12 | OKC | 62 | 1,834.0 | 1,783.9 | 29.6 | 28.8 |
| 2012-13 | HOU | 78 | 3,336.0 | 3,405.3 | 42.8 | 43.7 |
| 2013-14 | HOU | 73 | 3,114.0 | 3,099.8 | 42.7 | 42.5 |
| 2014-15 | HOU | 81 | 3,943.0 | 3,936.3 | 48.7 | 48.6 |
| 2015-16 | HOU | 82 | 4,035.0 | 4,091.2 | 49.2 | 49.9 |
| 2016-17 | HOU | 81 | 4,479.0 | 4,520.3 | 55.3 | 55.8 |
| 2017-18 | HOU | 72 | 3,929.0 | 3,815.8 | 54.6 | 53.0 |
| 2018-19 | HOU | 78 | 4,649.0 | 4,579.6 | 59.6 | 58.7 |
| 2019-20 | HOU | 68 | 3,950.0 | 3,885.2 | 58.1 | 57.1 |
| 2020-21 | HOU/BKN | 44 | 2,397.0 | 2,294.1 | 54.5 | 52.1 |
| 2021-22 | BKN/PHI | 65 | 3,074.0 | 3,102.5 | 47.3 | 47.7 |
| 2022-23 | PHI | 58 | 2,837.0 | 2,678.8 | 48.9 | 46.2 |
| 2023-24 | LAC | 72 | 2,981.0 | 2,772.8 | 41.4 | 38.5 |
| 2024-25 | LAC | 79 | 3,571.0 | 3,557.7 | 45.2 | 45.0 |
| 2025-26 | LAC/CLE | 70 | 3,045.0 | 2,966.7 | 43.5 | 42.4 |
| 2026-27 | CLE | 11 | 320.0 | 335.1 | 29.1 | 30.5 |
Career regular season
- GP
- 1,232
- ESPN
- 54,716.0
- YAHOO
- 54,080.4
- ESPN/G
- 44.4
- YAHOO/G
- 43.9
Bio
- Age
- 37 yearsAug 26, 1989
- Height
- 6' 5"
- Weight
- 220 lbs
- Experience
- 18 yearsDebut 2009
- Birthplace
- Los Angeles, CA
- Draft
- 2009Rd 1, Pk 3
- College
- Arizona State
- Salary
- $42.3 million2026-27
- MVP
- 2017-18
- Sixth Man of the Year
- 2011-12
- All-NBA First Team
- 6x
All awards (5)
- 1x MVP
- 1x Sixth Man of the Year
- 6x All-NBA First Team
- 2x All-NBA Third Team
- 1x All-Rookie Second Team
Latest performance

James Harden
Nov 11 · @ NY · W 115-107
- MIN
- 33
- PTS
- 32
- REB
- 2
- AST
- 4
- STL
- 2
- BLK
- 0
- FG%
- 64.3
- 3PTM
- 5
Games
All gamesNext
at MIAFri, Nov 13
vs MIA since 2009
- 47
- GP
- 1,009
- PTS
- 266
- REB
- 320
- AST
- 1,655
- MIN
| Date | Opponent | PTS | REB | AST | MIN |
|---|---|---|---|---|---|
| Wed, Nov 11 | at NYW 115-107 | 32 | 2 | 4 | 33 |
| Mon, Nov 09 | at CHAL 124-112 | 11 | 3 | 5 | 25 |
| Sat, Nov 07 | vsNYL 109-97 | 7 | 2 | 5 | 34 |
| Fri, Nov 06 | vsPHIW 119-95 | 17 | 6 | 3 | 30 |
| Wed, Nov 04 | at OKCL 124-116 | 19 | 9 | 6 | 35 |
| Mon, Nov 02 | vsOKCL 117-112 | 14 | 4 | 6 | 33 |
What are James Harden's career stats?
James Harden has played 18 seasons for the Thunder, the Rockets, the 76ers, the Clippers and the Cavaliers. He has scored 29,507 points with 6,862 rebounds and 8,936 assists in 1,232 games — 24.0 points, 5.6 rebounds and 7.3 assists per game. His best season so far is 2018-19: 2,818 points, 518 rebounds and 586 assists.
Milestones within reach
- 64 more assists for 9,000 — 8,936 now, 557 in his best season of the last two
- 493 more points for 30,000 — 29,507 now, 1,652 in his best season of the last two
- 83 more 3-pointers for 3,500 — 3,417 now, 215 in his best season of the last two
- 138 more rebounds for 7,000 — 6,862 now, 336 in his best season of the last two
Best single games
- Points: 61 vs SA on Mar 22, 2019, W 111-105
- Rebounds: 17 vs DET on Jan 20, 2016, L 123-114
- Assists: 21 vs LAC on Dec 23, 2022, W 119-114
- Steals: 8 vs UTAH on Mar 23, 2016, L 89-87
- Blocks: 5 @ DET on Feb 9, 2021, L 122-111
- 3-Pointers Made: 10 @ GS on Jan 3, 2019, W 135-134 OT
Regular season only, from NBA game logs since 2009-10.
League leaderboards and awards
18 seasons, 17 postseasons, 2009-10 to 2026-27
James Harden led the NBA in points per game (2017-18, 2018-19, 2019-20) and assists per game (2016-17, 2022-23); finished top 10 in a stat 24 times; sits top 10 all time in points and 3-pointers made.
Awards
- NBA All-Rookie Second Team: 2009-10
- NBA Sixth Man of the Year: 2011-12
- All-NBA Third Team ×2: 2012-13, 2024-25
- All-NBA First Team ×6: 2013-14, 2014-15, 2016-17, 2017-18, 2018-19, 2019-20
- NBA MVP: 2017-18
All-time career rank
- 9th in points (29,507)
- 118th in rebounds (6,862)
- 12th in assists (8,936)
- 2nd in 3-pointers made (3,417)
- 21st in steals (1,802)
- 172nd in blocks (689)
Among the 2,819 NBA players with a career line on file, regular season. A place deeper than 300th is not listed.
Season top 10 finishes
- Points per game: 2012-13 (5th), 2013-14 (5th), 2014-15 (2nd), 2015-16 (2nd), 2016-17 (2nd), 2017-18 (1st), 2018-19 (1st), 2019-20 (1st)
- Assists per game: 2014-15 (9th), 2015-16 (6th), 2016-17 (1st), 2017-18 (4th), 2019-20 (7th), 2020-21 (2nd), 2021-22 (2nd), 2022-23 (1st), 2023-24 (5th), 2024-25 (5th), 2025-26 (6th)
- Steals per game: 2012-13 (7th), 2014-15 (5th), 2017-18 (6th), 2018-19 (3rd), 2019-20 (5th)
Among qualified NBA players each season, as the glossary defines each stat. All-time places are among players on file.
James Harden college stats
James Harden played 2 seasons at Arizona State Sun Devils (2007-08 to 2008-09): 19.0 points, 5.4 rebounds and 3.7 assists a game over 69 games.
Per game
Totals
More
College seasons as ESPN files them for the school he played for.
More on James Harden
Playoff series
James Harden played 191 games across 17 NBA postseasons in 34 series — 17 won, 17 lost.
| PTS: Points scored — a free throw is worth 1, a shot inside the arc 2, beyond it 3. | REB: Missed shots the player collected, at either end of the floor. | AST: Passes that led directly to a team-mate's basket. | ||||
|---|---|---|---|---|---|---|
| 2025-26 |  TOR | Won 4-3 | 7 | 20.6 | 5.3 | 6.1 |
| 2025-26 |  DET | Won 4-3 | 7 | 19.6 | 5.1 | 6.3 |
| 2025-26 | NY | Lost 0-4 | 4 | 16.0 | 4.8 | 3.0 |
| 2024-25 |  DEN | Lost 3-4 | 7 | 18.7 | 5.4 | 9.1 |
| 2023-24 |  DAL | Lost 2-4 | 6 | 21.2 | 4.5 | 8.0 |
| 2022-23 | BKN | Won 4-0 | 4 | 17.3 | 5.5 | 8.8 |
| 2022-23 |  BOS | Lost 3-4 | 7 | 22.0 | 6.6 | 8.0 |
| 2021-22 | TOR | Won 4-2 | 6 | 19.0 | 5.0 | 10.2 |
| 2021-22 |  MIA | Lost 2-4 | 6 | 18.2 | 6.3 | 7.0 |
| 2020-21 | BOS | Won 4-1 | 5 | 27.8 | 7.2 | 10.6 |
| 2020-21 |  MIL | Lost 2-2 | 4 | 10.8 | 5.3 | 6.0 |
| 2019-20 | OKC | Won 4-3 | 7 | 29.7 | 6.3 | 8.0 |
| 2019-20 |  LAL | Lost 1-4 | 5 | 29.4 | 4.6 | 7.2 |
| 2018-19 |  UTAH | Won 4-1 | 5 | 27.8 | 6.8 | 8.0 |
| 2018-19 |  GS | Lost 2-4 | 6 | 34.8 | 6.8 | 5.5 |
| 2017-18 |  MIN | Won 4-1 | 5 | 29.0 | 4.8 | 7.4 |
| 2017-18 | UTAH | Won 4-1 | 5 | 28.0 | 5.2 | 7.4 |
| 2017-18 | GS | Lost 3-4 | 7 | 28.7 | 5.6 | 6.0 |
| 2016-17 | OKC | Won 4-1 | 5 | 33.2 | 6.4 | 7.0 |
| 2016-17 |  SA | Lost 2-4 | 6 | 24.5 | 4.7 | 9.7 |
| 2015-16 | GS | Lost 1-4 | 5 | 26.6 | 5.2 | 7.6 |
| 2014-15 | DAL | Won 4-1 | 5 | 28.4 | 3.8 | 7.8 |
| 2014-15 |  LAC | Won 4-3 | 7 | 25.4 | 5.6 | 8.1 |
| 2014-15 | GS | Lost 1-4 | 5 | 28.4 | 7.8 | 6.4 |
| 2013-14 |  POR | Lost 2-4 | 6 | 26.8 | 4.7 | 5.8 |
| 2012-13 | OKC | Lost 2-4 | 6 | 26.3 | 6.7 | 4.5 |
| 2011-12 | DAL | Won 4-0 | 4 | 18.3 | 5.5 | 4.3 |
| 2011-12 | LAL | Won 4-1 | 5 | 16.0 | 4.6 | 2.2 |
| 2011-12 | SA | Won 4-2 | 6 | 18.5 | 5.5 | 3.7 |
| 2011-12 | MIA | Lost 1-4 | 5 | 12.4 | 4.8 | 3.6 |
| 2010-11 | DEN | Won 4-1 | 5 | 10.4 | 5.6 | 3.0 |
| 2010-11 |  MEM | Won 4-3 | 7 | 13.9 | 4.7 | 4.1 |
| 2010-11 | DAL | Lost 1-4 | 5 | 14.4 | 6.0 | 3.4 |
| 2009-10 | LAL | Lost 2-4 | 6 | 7.7 | 2.5 | 1.8 |
James Harden’s playoff series, round by round
Per game, from NBA game logs since the 1946-47 postseason — earlier series are not counted.
James Harden against each club
- vs Dallas Mavericks (82)
- vs Golden State Warriors (74)
- vs Los Angeles Lakers (74)
- vs San Antonio Spurs (69)
- vs Memphis Grizzlies (67)
- vs Denver Nuggets (66)
- vs Oklahoma City Thunder (61)
- vs Utah Jazz (60)
- vs Minnesota Timberwolves (58)
- vs Portland Trail Blazers (58)
- vs New Orleans Pelicans (55)
- vs Sacramento Kings (53)
- vs LA Clippers (51)
- vs Miami Heat (50)
- vs Phoenix Suns (48)
- vs Toronto Raptors (47)
- vs Boston Celtics (46)
- vs New York Knicks (43)
- vs Detroit Pistons (41)
- vs Orlando Magic (40)
- vs Milwaukee Bucks (39)
- vs Indiana Pacers (38)
- vs Cleveland Cavaliers (37)
- vs Brooklyn Nets (36)
- vs Washington Wizards (35)
- vs Charlotte Hornets (33)
- vs Chicago Bulls (32)
- vs Philadelphia 76ers (32)
- vs Atlanta Hawks (31)
- vs Houston Rockets (25)
Similar players
Closest career per-game profiles to James Harden among NBA players at the same position.
- Cade CunninghamDETAlike in Rebounds, Points, Assists54out of 100 on profile similarity
- LaMelo BallMINAlike in Assists, Rebounds, Steals53out of 100 on profile similarity
- Kyrie IrvingDALAlike in Points, Steals, 3-Pointers Made45out of 100 on profile similarity
- Anthony EdwardsMINAlike in Points, Steals, Rebounds44out of 100 on profile similarity
- Luka DoncicLALAlike in Steals, Assists, 3-Pointers Made44out of 100 on profile similarity


Compare James Harden with Allen Iverson, Dwyane Wade, Kyrie Irving, LeBron James, Luka Doncic, Russell Westbrook, Stephen Curry, Cade Cunningham, LaMelo Ball, Anthony Edwards