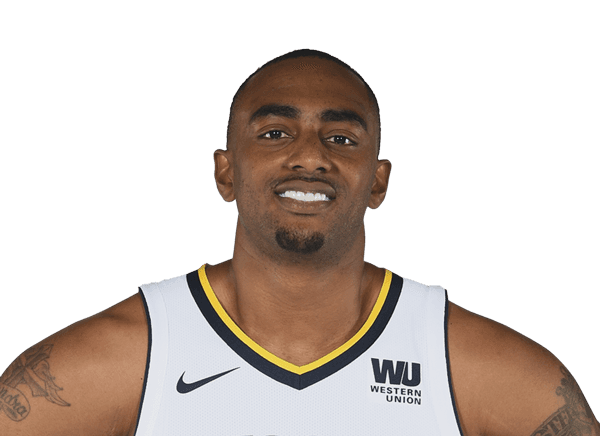
Darrell Arthur stats

Last played for the Denver Nuggets, 2017-18

Forward · #00

Age 38 · 6' 9"

Compare with…

Darrell Arthur played 9 NBA seasons, 2008-09 to 2017-18.

Stats

Choose how these numbers are shown

Per game

Career regular season

PTS
6.5
REB
3.5
AST
0.8
STL
0.6
BLK
0.6
TS%
49.5
MIN
17.8
GP
503
Per game by season
PTS: Points scored — a free throw is worth 1, a shot inside the arc 2, beyond it 3.REB: Missed shots the player collected, at either end of the floor.AST: Passes that led directly to a team-mate's basket.STL: Possessions taken off the opponent by picking off a pass or a dribble.BLK: Opponent shots swatted away before they reached the rim.TS%: Scoring per shot with threes and free throws counted: PTS ÷ (2 × (FGA + 0.44 × FTA)). League average sits near 58%.MIN: Minutes on the floor.GP: Games the player appeared in, however briefly.
2008-09MEM5.64.60.60.70.745.619.376
2009-10MEM4.53.40.50.40.444.914.332
2010-11MEM9.14.30.70.70.853.420.180
2012-13MEM6.12.90.60.40.647.716.459
2013-14DEN5.93.10.90.60.745.917.168
2014-15DEN6.62.91.00.80.446.617.058
2015-16DEN7.54.21.40.80.751.421.770
2016-17DEN6.42.71.00.50.558.315.641
2017-18DEN2.80.80.50.40.255.97.419

What the columns mean: PTS · REB · AST · STL · BLK · TS% · MIN · GP

Career Postseason

PTS
5.4
REB
2.4
AST
0.5
STL
0.3
BLK
0.6
TS%
50.2
MIN
13.4
GP
28

Totals

Career regular season

PTS
3,282
REB
1,768
AST
409
STL
309
BLK
307
TO
422
FGM
1,381
3PTM
161
Totals by season
PTS: Points scored — a free throw is worth 1, a shot inside the arc 2, beyond it 3.REB: Missed shots the player collected, at either end of the floor.AST: Passes that led directly to a team-mate's basket.STL: Possessions taken off the opponent by picking off a pass or a dribble.BLK: Opponent shots swatted away before they reached the rim.TO: Possessions handed to the opponent by a bad pass, a lost dribble or an offensive foul — lower is better.FGM: Shots made from the floor — everything except free throws.3PTM: Three-point shots made.
2008-09MEM422346435252471910
2009-10MEM14311015141422630
2010-11MEM729342535263883100
2012-13MEM362169332433431625
2013-14DEN4012106139475816224
2014-15DEN3821715748264715526
2015-16DEN5272939653486622145
2016-17DEN262112421921369553
2017-18DEN541598315228

What the columns mean: PTS · REB · AST · STL · BLK · TO · FGM · 3PTM

Per 36 min

Career regular season

PTS
13.1
REB
7.1
AST
1.6
STL
1.2
BLK
1.2
TS%
49.5
MIN
17.8
GP
503

Per 36 minutes: each per-game figure scaled by 36 ÷ minutes played. Derived here, and shooting percentages are left untouched because they do not scale.

Per 36 min by season
PTS: Points scored — a free throw is worth 1, a shot inside the arc 2, beyond it 3.REB: Missed shots the player collected, at either end of the floor.AST: Passes that led directly to a team-mate's basket.STL: Possessions taken off the opponent by picking off a pass or a dribble.BLK: Opponent shots swatted away before they reached the rim.TS%: Scoring per shot with threes and free throws counted: PTS ÷ (2 × (FGA + 0.44 × FTA)). League average sits near 58%.MIN: Minutes on the floor.GP: Games the player appeared in, however briefly.
2008-09MEM10.48.61.11.31.345.619.376
2009-10MEM11.38.61.31.01.044.914.332
2010-11MEM16.37.71.31.31.453.420.180
2012-13MEM13.46.41.30.91.347.716.459
2013-14DEN12.46.51.91.31.545.917.168
2014-15DEN14.06.12.11.70.846.617.058
2015-16DEN12.47.02.31.31.251.421.770
2016-17DEN14.86.22.31.21.258.315.641
2017-18DEN13.63.92.41.91.055.97.419

What the columns mean: PTS · REB · AST · STL · BLK · TS% · MIN · GP

Fantasy

Career regular season

GP
503
ESPN
7,191.0
YAHOO
7,443.1
ESPN/G
14.3
YAHOO/G
14.8

Fantasy points in ESPN’s and Yahoo’s default points leagues, worked out here from the season totals.

Fantasy by season
GP: Games the player appeared in, however briefly.ESPN: Fantasy points in ESPN’s default points scoring, worked out here from the season line.YAHOO: Fantasy points in Yahoo’s default points scoring, worked out here from the season line.ESPN/G: ESPN fantasy points per game played.YAHOO/G: Yahoo fantasy points per game played.
2008-09MEM761,102.01,166.714.515.4
2009-10MEM32318.0359.59.911.2
2010-11MEM801,432.01,475.917.918.4
2012-13MEM59696.0742.311.812.6
2013-14DEN68890.0944.513.113.9
2014-15DEN58808.0847.713.914.6
2015-16DEN701,269.01,259.618.118.0
2016-17DEN41571.0543.413.913.3
2017-18DEN19105.0103.55.55.4

What the columns mean: GP · ESPN/G

Bio

Age
38 yearsMar 25, 1988
Height
6' 9"
Debut
2008
Birthplace
Dallas, TX
Draft
2008Rd 1, Pk 27
College
Kansas

Latest performance

Darrell Arthur

Mar 21 · @ CHI · W 135-102

MIN
7
PTS
3
REB
0
AST
0
STL
0
BLK
1
FG%
50.0
3PTM
1
Most recent games
DateOpponentPTSREBASTMIN
Wed, Mar 21atCHIW 135-1023007
Sun, Mar 11vsSACW 130-1043004
Thu, Feb 15atMILW 134-12301212
Tue, Feb 13vsSAW 117-1095006
Sat, Feb 10atPHXW 123-1137207
Fri, Feb 09atHOUL 130-1044007

What were Darrell Arthur's career stats?

Darrell Arthur played 9 seasons for the Grizzlies and the Nuggets. He scored 3,282 points with 1,768 rebounds and 409 assists in 503 games — 6.5 points, 3.5 rebounds and 0.8 assists per game. His best season was 2010-11: 729 points, 342 rebounds and 53 assists.

League leaderboards and awards

9 seasons, 2 postseasons, 2008-09 to 2017-18

Darrell Arthur led the NBA in 3-point % (2016-17); finished top 10 in a stat 1 time.

Season top 10 finishes

Among qualified NBA players each season, as the glossary defines each stat. All-time places are among players on file.

Darrell Arthur college stats

Darrell Arthur played 2 seasons at Kansas Jayhawks (2006-07 to 2007-08): 11.3 points, 5.5 rebounds and 0.6 assists a game over 78 games.

Per game

Darrell Arthur's college Per game by season
GP: Games the player appeared in, however briefly.GS: Games the player was in the starting five.MIN: Minutes on the floor.FG%: Share of shots from the floor that went in. League average sits near 47%.3P%: Share of three-point attempts that went in. League average sits near 36%.FT%: Share of free throws that went in. League average sits near 78%.OR: Rebounds grabbed at the offensive end, which hand the team a fresh possession.DR: Rebounds grabbed at the defensive end, which end the opponent's possession.REB: Missed shots the player collected, at either end of the floor.AST: Passes that led directly to a team-mate's basket.BLK: Opponent shots swatted away before they reached the rim.STL: Possessions taken off the opponent by picking off a pass or a dribble.PF: Fouls committed. Six in one game and the player is disqualified — lower is better.TO: Possessions handed to the opponent by a bad pass, a lost dribble or an offensive foul — lower is better.PTS: Points scored — a free throw is worth 1, a shot inside the arc 2, beyond it 3.
2006-07Kansas Jayhawks387194.1-7.653.80.0-0.101.7-2.664.62.12.64.70.41.50.92.71.49.8
2007-08Kansas Jayhawks403924.75.4-9.954.30.1-0.316.72.0-2.970.22.346.30.81.30.531.912.8

Totals

Darrell Arthur's college Totals by season
FG%: Share of shots from the floor that went in. League average sits near 47%.3P%: Share of three-point attempts that went in. League average sits near 36%.FT%: Share of free throws that went in. League average sits near 78%.OR: Rebounds grabbed at the offensive end, which hand the team a fresh possession.DR: Rebounds grabbed at the defensive end, which end the opponent's possession.REB: Missed shots the player collected, at either end of the floor.AST: Passes that led directly to a team-mate's basket.BLK: Opponent shots swatted away before they reached the rim.STL: Possessions taken off the opponent by picking off a pass or a dribble.PF: Fouls committed. Six in one game and the player is disqualified — lower is better.TO: Possessions handed to the opponent by a bad pass, a lost dribble or an offensive foul — lower is better.PTS: Points scored — a free throw is worth 1, a shot inside the arc 2, beyond it 3.
2006-07Kansas Jayhawks155-28853.80-5064-9964.6789917717563310352374
2007-08Kansas Jayhawks214-39454.32-1216.780-11470.29215825033532011875510

More

Darrell Arthur's college More by season
DD2: Games with double figures in two categories, most often points and rebounds.TD3: Games with double figures in three categories — points, rebounds and assists, usually.EJECT: Times the player was thrown out of a game.TECH: Technical fouls, called for conduct rather than contact: arguing, taunting, hanging on the rim.FLAG: Fouls the officials judged unnecessary or excessive contact; two in a game is an ejection.
2006-07Kansas Jayhawks0020000.30.6-1.2990.54
2007-08Kansas Jayhawks0040100.40.3-1.2940.55

College seasons as ESPN files them for the school he played for.

More on Darrell Arthur

Playoff series

Darrell Arthur played 28 games across 2 NBA postseasons in 5 series — 3 won, 2 lost.

Darrell Arthur's line in each playoff series
PTS: Points scored — a free throw is worth 1, a shot inside the arc 2, beyond it 3.REB: Missed shots the player collected, at either end of the floor.AST: Passes that led directly to a team-mate's basket.
2012-13LACWon 4-264.33.00.3
2012-13OKCWon 4-153.21.60.0
2012-13SALost 0-444.03.01.0
2010-11SAWon 4-268.02.80.5
2010-11OKCLost 3-476.31.70.6

What the columns mean: PTS · REB · AST

Darrell Arthur’s playoff series, round by round

Per game, from NBA game logs since the 1946-47 postseason — earlier series are not counted.