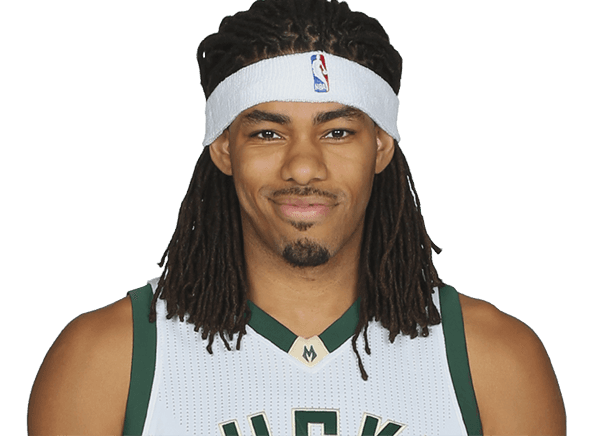
Chris Copeland stats

Last played for the Milwaukee Bucks, 2015-16

Small Forward · #22

Age 42 · 6' 8"

Compare with…

Chris Copeland played 4 NBA seasons, 2012-13 to 2015-16.

Stats

Choose how these numbers are shown

Per game

Career regular season

PTS
5.8
REB
1.6
AST
0.6
STL
0.2
BLK
0.2
TS%
54.0
MIN
12.3
GP
171

Ranked among NBA players who qualify (PTS, REB, AST, STL, BLK: 20+ games; TS%: 20+ games, 5+ FGA) that season; only the top 50 are shown. How each stat qualifies: glossary.

Per game by season
PTS: Points scored — a free throw is worth 1, a shot inside the arc 2, beyond it 3.REB: Missed shots the player collected, at either end of the floor.AST: Passes that led directly to a team-mate's basket.STL: Possessions taken off the opponent by picking off a pass or a dribble.BLK: Opponent shots swatted away before they reached the rim.TS%: Scoring per shot with threes and free throws counted: PTS ÷ (2 × (FGA + 0.44 × FTA)). League average sits near 58%.MIN: Minutes on the floor.GP: Games the player appeared in, however briefly.
2012-13NY8.72.10.50.30.258.315.456
2013-14IND3.70.80.40.10.262.16.541
2014-15IND6.22.21.00.20.246.816.650
2015-16MIL2.10.40.50.10.046.26.524

What the columns mean: PTS · REB · AST · STL · BLK · TS% · MIN · GP

Career Postseason

PTS
3.5
REB
0.7
AST
0.1
STL
0.4
BLK
0.1
TS%
58.1
MIN
8.3
GP
21

Totals

Career regular season

PTS
998
REB
272
AST
107
STL
32
BLK
30
TO
129
FGM
366
3PTM
154
Totals by season
PTS: Points scored — a free throw is worth 1, a shot inside the arc 2, beyond it 3.REB: Missed shots the player collected, at either end of the floor.AST: Passes that led directly to a team-mate's basket.STL: Possessions taken off the opponent by picking off a pass or a dribble.BLK: Opponent shots swatted away before they reached the rim.TO: Possessions handed to the opponent by a bad pass, a lost dribble or an offensive foul — lower is better.FGM: Shots made from the floor — everything except free throws.3PTM: Three-point shots made.
2012-13NY4861192716125018259
2013-14IND153321837145533
2014-15IND3091115111115911252
2015-16MIL5010112061710

What the columns mean: PTS · REB · AST · STL · BLK · TO · FGM · 3PTM

Per 36 min

Career regular season

PTS
17.0
REB
4.7
AST
1.8
STL
0.6
BLK
0.6
TS%
54.0
MIN
12.3
GP
171

Per 36 minutes: each per-game figure scaled by 36 ÷ minutes played. Derived here, and shooting percentages are left untouched because they do not scale.

Per 36 min by season
PTS: Points scored — a free throw is worth 1, a shot inside the arc 2, beyond it 3.REB: Missed shots the player collected, at either end of the floor.AST: Passes that led directly to a team-mate's basket.STL: Possessions taken off the opponent by picking off a pass or a dribble.BLK: Opponent shots swatted away before they reached the rim.TS%: Scoring per shot with threes and free throws counted: PTS ÷ (2 × (FGA + 0.44 × FTA)). League average sits near 58%.MIN: Minutes on the floor.GP: Games the player appeared in, however briefly.
2012-13NY20.34.91.20.70.558.315.456
2013-14IND20.54.42.20.61.162.16.541
2014-15IND13.44.82.20.40.446.816.650
2015-16MIL11.62.22.80.60.046.26.524

What the columns mean: PTS · REB · AST · STL · BLK · TS% · MIN · GP

Fantasy

Career regular season

GP
171
ESPN
1,465.0
YAHOO
1,541.9
ESPN/G
8.6
YAHOO/G
9.0

Fantasy points in ESPN’s and Yahoo’s default points leagues, worked out here from the season totals.

Fantasy by season
GP: Games the player appeared in, however briefly.ESPN: Fantasy points in ESPN’s default points scoring, worked out here from the season line.YAHOO: Fantasy points in Yahoo’s default points scoring, worked out here from the season line.ESPN/G: ESPN fantasy points per game played.YAHOO/G: Yahoo fantasy points per game played.
2012-13NY56694.0703.312.412.6
2013-14IND41255.0234.46.25.7
2014-15IND50446.0525.78.910.5
2015-16MIL2470.078.52.93.3

What the columns mean: GP · ESPN/G

Bio

Age
42 yearsMar 17, 1984
Height
6' 8"
Debut
2012
Birthplace
Orange, NJ
College
Colorado

Latest performance

Chris Copeland

Feb 02 · @ POR · L 107-95

MIN
3
PTS
0
REB
0
AST
0
STL
0
BLK
0
FG%
0.0
3PTM
0
Most recent games
DateOpponentPTSREBASTMIN
Tue, Feb 02atPORL 107-950003
Thu, Jan 28atMEML 103-832017
Sat, Jan 23atNOL 116-993003
Tue, Jan 19atMIAW 91-790002
Sat, Jan 16atCHAW 105-923103
Mon, Jan 04vsSAL 123-983005

What were Chris Copeland's career stats?

Chris Copeland played 4 seasons for the Knicks, the Pacers and the Bucks. He scored 998 points with 272 rebounds and 107 assists in 171 games — 5.8 points, 1.6 rebounds and 0.6 assists per game. His best season was 2012-13: 486 points, 119 rebounds and 27 assists.

Chris Copeland college stats

Chris Copeland played 4 seasons at Colorado Buffaloes (2002-03 to 2005-06): 7.5 points, 3.8 rebounds and 1.0 assists a game over 113 games.

Per game

Chris Copeland's college Per game by season
GP: Games the player appeared in, however briefly.GS: Games the player was in the starting five.MIN: Minutes on the floor.FG%: Share of shots from the floor that went in. League average sits near 47%.3P%: Share of three-point attempts that went in. League average sits near 36%.FT%: Share of free throws that went in. League average sits near 78%.OR: Rebounds grabbed at the offensive end, which hand the team a fresh possession.DR: Rebounds grabbed at the defensive end, which end the opponent's possession.REB: Missed shots the player collected, at either end of the floor.AST: Passes that led directly to a team-mate's basket.BLK: Opponent shots swatted away before they reached the rim.STL: Possessions taken off the opponent by picking off a pass or a dribble.PF: Fouls committed. Six in one game and the player is disqualified — lower is better.TO: Possessions handed to the opponent by a bad pass, a lost dribble or an offensive foul — lower is better.PTS: Points scored — a free throw is worth 1, a shot inside the arc 2, beyond it 3.
2002-03Colorado Buffaloes2607.70.9-2.337.70.2-0.8250.6-1.057.70.611.60.30.30.110.72.5
2003-04Colorado Buffaloes2809.20.9-2.437.90.4-1.039.30.7-1.159.40.81.82.50.50.50.31.70.82.9
2004-05Colorado Buffaloes291425.24.0-8.944.81.8-4.737.52.0-2.481.41.73.95.61.51.20.32.81.911.7
2005-06Colorado Buffaloes302824.34.1-9.4441.7-4.735.72.1-3.168.81.73.45.11.61.10.82.41.512.1

Totals

Chris Copeland's college Totals by season
FG%: Share of shots from the floor that went in. League average sits near 47%.3P%: Share of three-point attempts that went in. League average sits near 36%.FT%: Share of free throws that went in. League average sits near 78%.OR: Rebounds grabbed at the offensive end, which hand the team a fresh possession.DR: Rebounds grabbed at the defensive end, which end the opponent's possession.REB: Missed shots the player collected, at either end of the floor.AST: Passes that led directly to a team-mate's basket.BLK: Opponent shots swatted away before they reached the rim.STL: Possessions taken off the opponent by picking off a pass or a dribble.PF: Fouls committed. Six in one game and the player is disqualified — lower is better.TO: Possessions handed to the opponent by a bad pass, a lost dribble or an offensive foul — lower is better.PTS: Points scored — a free throw is worth 1, a shot inside the arc 2, beyond it 3.
2002-03Colorado Buffaloes23-6137.75-202515-2657.7152742872251966
2003-04Colorado Buffaloes25-6637.911-2839.319-3259.421497014137482180
2004-05Colorado Buffaloes116-25944.851-13637.557-7081.4481131614336108254340
2005-06Colorado Buffaloes124-2824450-14035.764-9368.8501021524732237246362

More

Chris Copeland's college More by season
DD2: Games with double figures in two categories, most often points and rebounds.TD3: Games with double figures in three categories — points, rebounds and assists, usually.EJECT: Times the player was thrown out of a game.TECH: Technical fouls, called for conduct rather than contact: arguing, taunting, hanging on the rim.FLAG: Fouls the officials judged unnecessary or excessive contact; two in a game is an ejection.
2002-03Colorado Buffaloes0000000.40.1-1.0820.42
2003-04Colorado Buffaloes0020000.70.3-1.2120.46
2004-05Colorado Buffaloes0030000.80.2-1.3130.55
2005-06Colorado Buffaloes00101010.5-1.2840.53

College seasons as ESPN files them for the school he played for.

More on Chris Copeland

Playoff series

Chris Copeland played 20 games across 2 NBA postseasons in 5 series — 2 won, 3 lost.

Chris Copeland's line in each playoff series
PTS: Points scored — a free throw is worth 1, a shot inside the arc 2, beyond it 3.REB: Missed shots the player collected, at either end of the floor.AST: Passes that led directly to a team-mate's basket.
2013-14ATLWon 3-253.60.80.0
2013-14WSHLost 1-234.00.30.3
2013-14MIALost 1-232.00.00.0
2012-13BOSWon 3-030.00.30.0
2012-13INDLost 2-466.21.30.2

What the columns mean: PTS · REB · AST

Chris Copeland’s playoff series, round by round

Per game, from NBA game logs since the 1946-47 postseason — earlier series are not counted.