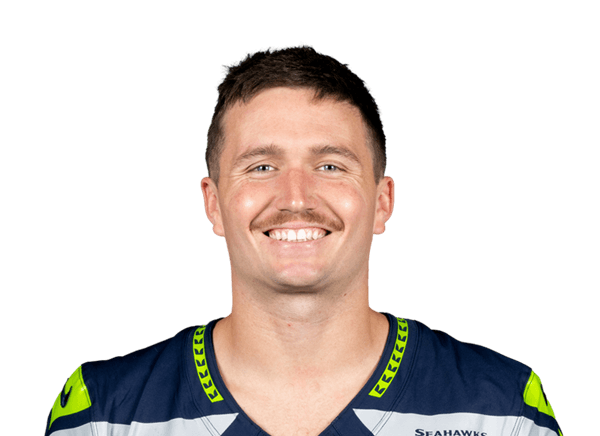
Drew Lock stats
SeahawksBio
- Age
- 29 yearsNov 10, 1996
- Height
- 6' 4"
- Weight
- 228 lbs

Drew Lock recorded 422 passing yards, 4 passing touchdowns and 0 interceptions thrown in 2 games of 2026 for the Seattle Seahawks. Last game: .
Stats
Totals
 Seahawks
- GP
- 2
- CMP
- 35
- ATT
- 48
- CMP%
- 72.9
- YDS
- 422
- AVG
- 8.8
- TD
- 4
- INT
- 0
Ranked among NFL players who qualify (CMP, YDS, TD: 4+ games, 100+ ATT; CMP%, AVG: 4+ games, 200+ ATT) that season; only the top 50 are shown. How each stat qualifies: glossary.
What the columns mean: CMP · CMP% · INT
Bold marks the best figure in the NFL that season, among players with at least 4 games.
Career regular season
- GP
- 43
- CMP
- 613
- ATT
- 1,018
- CMP%
- 60.2
- YDS
- 6,791
- AVG
- 6.7
- TD
- 38
- INT
- 28
Career Postseason
- GP
- 1
Per game
- GP
- 2
- CMP
- 17.5
- ATT
- 24
- CMP%
- 72.9
- YDS
- 211
- AVG
- 8.8
- TD
- 2
- INT
- 0
Per game: season totals ÷ games played. Derived here — averages, completion rate and longest plays are the stored figures and are left as they are.
What the columns mean: CMP · CMP% · INT
Bold marks the best figure in the NFL that season, among players with at least 4 games.
Career regular season, Per game
- GP
- 43
- CMP
- 14.3
- ATT
- 23.7
- CMP%
- 60.2
- YDS
- 157.9
- AVG
- 6.7
- TD
- 0.9
- INT
- 0.7
Fantasy
- GP
- 2
- PPR
- 34.2
- HALF
- 34.2
- STD
- 34.2
- PPG
- 17.1
Fantasy points in ESPN’s default scoring, worked out here from the season lines: PPR with a point per catch, half-PPR with half, standard with none.
Ranked among NFL players with 4+ games that season; only the top 50 are shown. How each stat qualifies: glossary.
Career regular season
- GP
- 43
- PPR
- 450.7
- HALF
- 450.2
- STD
- 449.7
- PPG
- 10.5
Bio
- Age
- 29 yearsNov 10, 1996
- Height
- 6' 4"
- Weight
- 228 lbs
- Experience
- 8 yearsDebut 2019
- Birthplace
- Lee's Summit, MO
- Draft
- 2019Rd 2, Pk 42
- College
- Missouri
- Salary
- $2.25 million2026
Latest performance

Drew Lock
Oct 11 · vs SF · L 32-29
- CMP
- 0
- ATT
- 0
- YDS
- 0
- TD
- 0
- INT
- 0
- RTG
- 0.0
His top receivers, 2026
Seattle Seahawks's pass catchers by receiving yards.
| Player | TGTS | REC | YDS | TD |
|---|---|---|---|---|
| Jaxon Smith-NjigbaWR | 89 | 64 | 985 | 9 |
| Cooper KuppWR | 30 | 19 | 206 | 2 |
| AJ BarnerTE | 33 | 21 | 203 | 0 |
| Rashid ShaheedWR | 29 | 16 | 163 | 0 |
| Tory HortonWR | 16 | 8 | 93 | 1 |
Snap counts, 2026
95% of his club's offensive snaps a game (115 in 2 games); 100% in week 2.
| Wk | Opp | Snaps | Snap % | ST |
|---|---|---|---|---|
| 1 | NE | 45 | 90% | 0 |
| 2 | ARI | 70 | 100% | 0 |
Injury history
Drew Lock has been on the NFL’s game-status report 2 weeks since 2026.
| Season | Out | D / Q | Injuries listed |
|---|---|---|---|
| 2026 | 0 | 2 | Elbow, Forearm |
From the weekly injury reports clubs file (nflverse), regular season and playoffs; a practice-only listing counts no week. A player moved to injured reserve leaves the report, so a season-ending injury shows only up to that move.
2019 NFL combine
QB, 6'4", 228 lb · Missouri
| Measure | Result | Percentile |
|---|---|---|
| 40-yard dash | 4.69s | 75th |
| Vertical jump | 31" | 44th |
| Broad jump | 9' 4" | 50th |
| 3-cone drill | 7.03s | 68th |
| 20-yard shuttle | 4.12s | 86th |
Percentile: the share of QBs measured at the combine since 2000 he beat. The 2019 combine
Games
All gamesNext
vs ARISun, Nov 08
vs ARI since 2025
- 2
- GP
- 19
- CMP
- 26
- ATT
- 235
- YDS
- 3
- TD
- 0
- INT
| Date | Opponent | CMP | ATT | YDS | TD | INT |
|---|---|---|---|---|---|---|
| Sun, Oct 11 | vs SFL 32-29 | 0 | 0 | 0 | 0 | 0 |
| Sun, Sep 27 | at WSHL 33-31 | 0 | 0 | 0 | 0 | 0 |
| Sun, Sep 20 | at ARIW 31-7 | 19 | 26 | 235 | 3 | 0 |
| Wed, Sep 09 | vs NEW 13-10 | 16 | 22 | 187 | 1 | 0 |
| Sat, Jan 17 | vsSFW 41-6 | 0 | 0 | 0 | 0 | 0 |
| Sun, Dec 07 | at ATLW 37-9 | 0 | 0 | 0 | 0 | 0 |
What are Drew Lock's career stats?
Drew Lock has played 7 seasons for the Broncos, the Seahawks and the Giants. He has completed 613 of 1,018 passes for 6,791 yards, 38 touchdowns and 28 interceptions. His best season so far is 2020: 2,933 passing yards, 16 passing touchdowns and 15 interceptions thrown.
Best single games
- Passing Yards: 339 vs LV on Jan 3, 2021, L 32-31
- Passing Touchdowns: 4 @ CAR on Dec 13, 2020, W 32-27
- Rushing Yards: 59 vs NO on Dec 8, 2024, L 14-11
- Rushing Touchdowns: 2 vs KC on Jan 8, 2022, L 28-24
- Sacks: 6 @ DAL on Nov 28, 2024, L 27-20
Regular season only, from NFL game logs since 2019.
League leaderboards and awards
7 seasons, 1 postseason, 2019 to 2026
Championships
- 2025 Super Bowl with the Seattle Seahawks
All-time career rank
- 198th in passing yards (6,791)
- 202nd in passing touchdowns (38)
Among the 2,842 NFL players with a career line on file, regular season. A place deeper than 300th is not listed.
Drew Lock college stats
Drew Lock played 4 seasons at Missouri Tigers (2015 to 2018): 12,193 passing yards, 99 touchdown passes and 39 interceptions.
passing
rushing
receiving
defensive
scoring
College seasons as ESPN files them for the school he played for. Game by game: Drew Lock's college game log.
More on Drew Lock
Playoff games
Drew Lock played 1 game across 1 NFL postseason — 1 won, 0 lost.
| Season | Opp | Result | YDSYDS: Yards gained through the air, on the ground or after a catch, whichever this table counts. | TDTD: Touchdowns, worth six points before the extra point. | INTINT: Interceptions — thrown away by a quarterback, taken by a defender. |
|---|---|---|---|---|---|
| 2025 | SF | W 41-6 | 0 | 0 | 0 |
What the columns mean: INT
Totals, from NFL game logs since the 1994 postseason — earlier games are not counted.
Drew Lock against each club
- vs Los Angeles Chargers (5)
- vs Kansas City Chiefs (4)
- vs Las Vegas Raiders (4)
- vs Atlanta Falcons (3)
- vs Philadelphia Eagles (3)
- vs San Francisco 49ers (3)
- vs Washington Commanders (3)
- vs Arizona Cardinals (2)
- vs New England Patriots (2)
- vs New Orleans Saints (2)
- vs Baltimore Ravens (1)
- vs Buffalo Bills (1)
- vs Carolina Panthers (1)
- vs Cincinnati Bengals (1)
- vs Dallas Cowboys (1)
- vs Detroit Lions (1)
- vs Houston Texans (1)
- vs Indianapolis Colts (1)
- vs Los Angeles Rams (1)
- vs Miami Dolphins (1)
- vs Minnesota Vikings (1)
- vs New York Giants (1)
- vs Pittsburgh Steelers (1)
- vs Tampa Bay Buccaneers (1)
- vs Tennessee Titans (1)
Similar players
Closest career per-game profiles to Drew Lock among NFL players at the same position.
- Taylor HeinickeAlike in Completion %86out of 100 on profile similarity
- Davis MillsHOUAlike in Completion %80out of 100 on profile similarity
- Robert Griffin IIIAlike in Completion %79out of 100 on profile similarity
- Justin FieldsKCAlike in Completion %78out of 100 on profile similarity
- Marcus MariotaWSHAlike in Completion %73out of 100 on profile similarity


Compare Drew Lock with Taylor Heinicke, Davis Mills, Robert Griffin III