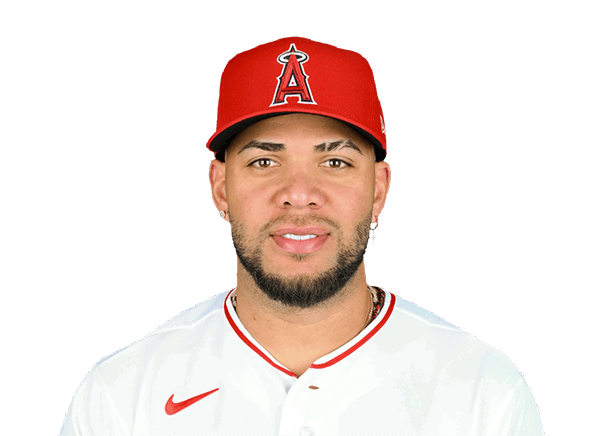
Yoan Moncada 2020 season stats
White Sox
Yoan Moncada played 52 games for the Chicago White Sox in the 2020 MLB regular season, with a .225 batting average, 6 home runs and 24 RBI.
2020 season stats
2020 regular season White Sox
- GP
- 52
- AB
- 200
- R
- 28
- H
- 45
- HR
- 6
- RBI
- 24
- SB
- 0
- AVG
- .225
- OBP
- .320
- SLG
- .385
- OPS
- .705
- 2B
- 8
2020 postseasonWhite Sox
- GP
- 3
- AB
- 13
- R
- 1
- H
- 1
- HR
- 0
- RBI
- 0
- SB
- 1
- AVG
- .077
- OBP
- .143
- SLG
- .077
- OPS
- .220
- 2B
- 0
2020 splits
Totals, from the 52 regular-season games in the log.
By opponent
2020 game log
| AB: At-bats: trips to the plate that ended in a hit, an out or an error. Walks and sacrifices are not counted. | R: Runs — scored by the batter, or allowed by the pitcher. | H: Times the batter reached base by hitting the ball, without help from an error. | HR: Home runs hit. | RBI: Runs that scored because of this batter's plate appearance. | SB: Bases taken while the pitcher was delivering. Being caught is counted separately. | AVG: Hits per at-bat. .300 is the traditional line between a good hitter and a great one. | OBP: Share of plate appearances that ended with the batter on base — hits, walks and hit-by-pitches. | SLG: Total bases per at-bat, so a home run counts four times a single. | OPS: On-base percentage plus slugging. Around .800 is All-Star level, .900 is MVP territory. | |||
|---|---|---|---|---|---|---|---|---|---|---|---|---|
| Sep 27, 2020 |  vs CHC | L 10-8 | 4 | 2 | 1 | 0 | 0 | 0 | .225 | .320 | .385 | .705 |
| Sep 26, 2020 | vs CHC | W 9-5 | 4 | 2 | 2 | 1 | 3 | 0 | .224 | .319 | .388 | .706 |
| Sep 25, 2020 | vs CHC | L 10-0 | 4 | 0 | 0 | 0 | 0 | 0 | .219 | .312 | .370 | .682 |
| Sep 24, 2020 |  @ CLE | L 5-4 | 4 | 1 | 1 | 0 | 0 | 0 | .223 | .318 | .378 | .696 |
| Sep 23, 2020 | @ CLE | L 3-2 | 3 | 1 | 1 | 0 | 0 | 0 | .223 | .319 | .370 | .689 |
| Sep 22, 2020 | @ CLE | L 5-3 F/10 | 5 | 0 | 0 | 0 | 0 | 0 | .221 | .316 | .359 | .675 |
| Sep 21, 2020 | @ CLE | L 7-4 | 4 | 0 | 0 | 0 | 0 | 0 | .227 | .324 | .369 | .693 |
| Sep 20, 2020 |  @ CIN | L 7-3 | 2 | 0 | 0 | 0 | 0 | 0 | .233 | .327 | .378 | .705 |
| Sep 19, 2020 | @ CIN | W 5-0 | 3 | 0 | 1 | 0 | 0 | 0 | .235 | .330 | .382 | .712 |
| Sep 18, 2020 | @ CIN | L 7-1 | 3 | 0 | 0 | 0 | 0 | 0 | .234 | .326 | .371 | .698 |
| Sep 17, 2020 |  vs MIN | W 4-3 | 4 | 0 | 0 | 0 | 0 | 0 | .238 | .328 | .378 | .706 |
| Sep 16, 2020 | vs MIN | L 5-1 | 3 | 0 | 0 | 0 | 0 | 0 | .244 | .335 | .388 | .723 |
| Sep 15, 2020 | vs MIN | W 6-2 | 5 | 0 | 0 | 0 | 0 | 0 | .248 | .341 | .395 | .736 |
| Sep 14, 2020 | vs MIN | W 3-1 | 1 | 2 | 0 | 0 | 0 | 0 | .257 | .350 | .408 | .758 |
| Sep 13, 2020 |  vs DET | W 5-2 | 4 | 0 | 3 | 0 | 1 | 0 | .258 | .341 | .411 | .752 |
What the columns mean: AB · R · H · HR · RBI · SB · AVG · OBP · SLG · OPS
All 52 gamesOnly the last 15 games
| AB: At-bats: trips to the plate that ended in a hit, an out or an error. Walks and sacrifices are not counted. | R: Runs — scored by the batter, or allowed by the pitcher. | H: Times the batter reached base by hitting the ball, without help from an error. | HR: Home runs hit. | RBI: Runs that scored because of this batter's plate appearance. | SB: Bases taken while the pitcher was delivering. Being caught is counted separately. | AVG: Hits per at-bat. .300 is the traditional line between a good hitter and a great one. | OBP: Share of plate appearances that ended with the batter on base — hits, walks and hit-by-pitches. | SLG: Total bases per at-bat, so a home run counts four times a single. | OPS: On-base percentage plus slugging. Around .800 is All-Star level, .900 is MVP territory. | |||
|---|---|---|---|---|---|---|---|---|---|---|---|---|
| Sep 27, 2020 | vs CHC | L 10-8 | 4 | 2 | 1 | 0 | 0 | 0 | .225 | .320 | .385 | .705 |
| Sep 26, 2020 | vs CHC | W 9-5 | 4 | 2 | 2 | 1 | 3 | 0 | .224 | .319 | .388 | .706 |
| Sep 25, 2020 | vs CHC | L 10-0 | 4 | 0 | 0 | 0 | 0 | 0 | .219 | .312 | .370 | .682 |
| Sep 24, 2020 | @ CLE | L 5-4 | 4 | 1 | 1 | 0 | 0 | 0 | .223 | .318 | .378 | .696 |
| Sep 23, 2020 | @ CLE | L 3-2 | 3 | 1 | 1 | 0 | 0 | 0 | .223 | .319 | .370 | .689 |
| Sep 22, 2020 | @ CLE | L 5-3 F/10 | 5 | 0 | 0 | 0 | 0 | 0 | .221 | .316 | .359 | .675 |
| Sep 21, 2020 | @ CLE | L 7-4 | 4 | 0 | 0 | 0 | 0 | 0 | .227 | .324 | .369 | .693 |
| Sep 20, 2020 | @ CIN | L 7-3 | 2 | 0 | 0 | 0 | 0 | 0 | .233 | .327 | .378 | .705 |
| Sep 19, 2020 | @ CIN | W 5-0 | 3 | 0 | 1 | 0 | 0 | 0 | .235 | .330 | .382 | .712 |
| Sep 18, 2020 | @ CIN | L 7-1 | 3 | 0 | 0 | 0 | 0 | 0 | .234 | .326 | .371 | .698 |
| Sep 17, 2020 | vs MIN | W 4-3 | 4 | 0 | 0 | 0 | 0 | 0 | .238 | .328 | .378 | .706 |
| Sep 16, 2020 | vs MIN | L 5-1 | 3 | 0 | 0 | 0 | 0 | 0 | .244 | .335 | .388 | .723 |
| Sep 15, 2020 | vs MIN | W 6-2 | 5 | 0 | 0 | 0 | 0 | 0 | .248 | .341 | .395 | .736 |
| Sep 14, 2020 | vs MIN | W 3-1 | 1 | 2 | 0 | 0 | 0 | 0 | .257 | .350 | .408 | .758 |
| Sep 13, 2020 | vs DET | W 5-2 | 4 | 0 | 3 | 0 | 1 | 0 | .258 | .341 | .411 | .752 |
| Sep 12, 2020 | vs DET | W 14-0 | 6 | 1 | 1 | 0 | 0 | 0 | .245 | .331 | .395 | .726 |
| Sep 9, 2020 |  @ PIT | W 8-1 | 5 | 1 | 2 | 0 | 1 | 0 | .248 | .337 | .404 | .742 |
| Sep 8, 2020 | @ PIT | L 5-4 | 5 | 1 | 2 | 0 | 1 | 0 | .243 | .335 | .397 | .733 |
| Sep 5, 2020 |  @ KC | W 5-3 | 4 | 0 | 0 | 0 | 0 | 0 | .237 | .333 | .397 | .730 |
| Sep 4, 2020 | @ KC | W 7-4 | 3 | 1 | 1 | 0 | 0 | 0 | .244 | .342 | .409 | .752 |
| Sep 3, 2020 | @ KC | W 11-6 | 3 | 0 | 0 | 0 | 1 | 0 | .242 | .333 | .411 | .745 |
| Sep 2, 2020 | @ MIN | L 8-1 | 3 | 0 | 0 | 0 | 0 | 0 | .248 | .338 | .421 | .760 |
| Aug 29, 2020 | vs KC | L 9-6 | 3 | 0 | 0 | 0 | 1 | 0 | .254 | .341 | .432 | .773 |
| Aug 28, 2020 | vs KC | W 6-5 | 4 | 1 | 2 | 0 | 1 | 0 | .261 | .338 | .443 | .782 |
| Aug 26, 2020 | vs PIT | W 10-3 | 4 | 1 | 2 | 0 | 0 | 0 | .252 | .333 | .441 | .775 |
| Aug 25, 2020 | vs PIT | W 4-0 | 3 | 1 | 0 | 0 | 0 | 0 | .243 | .328 | .421 | .748 |
| Aug 23, 2020 | @ CHC | L 2-1 | 5 | 0 | 1 | 0 | 0 | 0 | .250 | .331 | .433 | .763 |
| Aug 22, 2020 | @ CHC | W 7-4 | 5 | 0 | 0 | 0 | 0 | 0 | .253 | .336 | .444 | .781 |
| Aug 20, 2020 | vs DET | W 9-0 | 2 | 2 | 0 | 0 | 0 | 0 | .266 | .352 | .468 | .820 |
| Aug 19, 2020 | vs DET | W 5-3 | 4 | 0 | 1 | 0 | 1 | 0 | .272 | .340 | .478 | .818 |
| Aug 18, 2020 | vs DET | W 10-4 | 2 | 1 | 1 | 0 | 2 | 0 | .273 | .343 | .489 | .832 |
| Aug 17, 2020 | vs DET | W 7-2 | 5 | 1 | 2 | 1 | 1 | 0 | .267 | .330 | .488 | .818 |
| Aug 16, 2020 |  vs STL | W 7-2 | 4 | 1 | 1 | 1 | 3 | 0 | .259 | .326 | .457 | .783 |
| Aug 15, 2020 | vs STL | L 6-3 F/7 | 2 | 0 | 0 | 0 | 0 | 0 | .260 | .329 | .429 | .758 |
| Aug 15, 2020 | vs STL | L 5-1 F/7 | 3 | 0 | 0 | 0 | 1 | 0 | .267 | .329 | .440 | .769 |
| Aug 11, 2020 | @ DET | W 8-4 | 5 | 0 | 0 | 0 | 1 | 0 | .278 | .342 | .458 | .800 |
| Aug 10, 2020 | @ DET | L 5-1 | 4 | 0 | 1 | 0 | 0 | 0 | .299 | .365 | .493 | .857 |
| Aug 9, 2020 | vs CLE | L 5-4 F/10 | 4 | 1 | 1 | 0 | 0 | 0 | .302 | .371 | .508 | .879 |
| Aug 8, 2020 | vs CLE | L 7-1 | 5 | 1 | 1 | 1 | 1 | 0 | .305 | .369 | .508 | .878 |
| Aug 7, 2020 | vs CLE | W 2-0 | 4 | 0 | 1 | 0 | 0 | 0 | .315 | .383 | .481 | .865 |
| Aug 6, 2020 |  vs MIL | L 8-3 | 4 | 0 | 1 | 0 | 0 | 0 | .320 | .393 | .500 | .893 |
| Aug 5, 2020 | vs MIL | L 1-0 | 4 | 0 | 1 | 0 | 0 | 0 | .326 | .404 | .522 | .926 |
| Aug 4, 2020 | @ MIL | W 3-2 | 5 | 0 | 1 | 0 | 0 | 0 | .333 | .417 | .548 | .964 |
| Aug 3, 2020 | @ MIL | W 6-4 | 5 | 2 | 3 | 1 | 1 | 0 | .351 | .442 | .595 | 1.036 |
| Aug 2, 2020 | @ KC | W 9-2 | 3 | 0 | 0 | 0 | 0 | 0 | .313 | .421 | .469 | .890 |
| Aug 1, 2020 | @ KC | W 11-5 | 5 | 2 | 3 | 0 | 0 | 0 | .345 | .424 | .517 | .941 |
| Jul 31, 2020 | @ KC | W 3-2 | 3 | 0 | 0 | 0 | 0 | 0 | .292 | .370 | .500 | .870 |
| Jul 29, 2020 | @ CLE | W 4-0 | 3 | 1 | 0 | 0 | 0 | 0 | .333 | .391 | .571 | .963 |
| Jul 28, 2020 | @ CLE | L 5-3 F/9 | 4 | 0 | 1 | 0 | 0 | 0 | .389 | .421 | .667 | 1.088 |
| Jul 28, 2020 | @ CLE | L 4-3 F/9 | 5 | 0 | 2 | 0 | 0 | 0 | .429 | .467 | .786 | 1.252 |
| Jul 25, 2020 | vs MIN | W 10-3 | 4 | 0 | 1 | 0 | 1 | 0 | .444 | .500 | 1.000 | 1.500 |
| Jul 24, 2020 | vs MIN | L 10-5 | 5 | 1 | 3 | 1 | 3 | 0 | .600 | .600 | 1.400 | 2.000 |
What the columns mean: AB · R · H · HR · RBI · SB · AVG · OBP · SLG · OPS
Answered about Yoan Moncada in 2020
- How many hits did Yoan Moncada have in 2020?
- Yoan Moncada playoff RBI in 2020
- How many home runs did Yoan Moncada have in 2020?
- How many RBI did Yoan Moncada have in 2020?
- How many stolen bases did Yoan Moncada have in 2020?
- Yoan Moncada batting average in 2020
- Yoan Moncada playoff batting average in 2020
- Yoan Moncada playoff hits in 2020
- Yoan Moncada playoff home runs in 2020
- Yoan Moncada playoff stolen bases in 2020
Source: ESPN public MLB data, 2020 season.