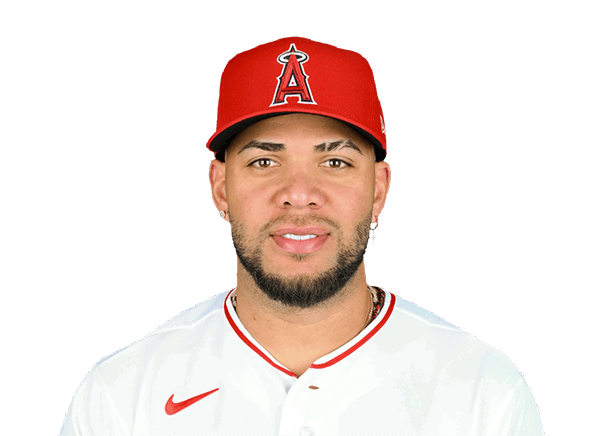
Yoan Moncada 2017 season stats
White Sox
Yoan Moncada played 54 games for the Chicago White Sox in the 2017 MLB regular season, with a .231 batting average, 8 home runs and 22 RBI.
2017 season stats
2017 regular season White Sox
- GP
- 54
- AB
- 199
- R
- 31
- H
- 46
- HR
- 8
- RBI
- 22
- SB
- 3
- AVG
- .231
- OBP
- .338
- SLG
- .412
- OPS
- .750
- 2B
- 8
2017 splits
Totals, from the 54 regular-season games in the log.
By opponent
2017 game log
| AB: At-bats: trips to the plate that ended in a hit, an out or an error. Walks and sacrifices are not counted. | R: Runs — scored by the batter, or allowed by the pitcher. | H: Times the batter reached base by hitting the ball, without help from an error. | HR: Home runs hit. | RBI: Runs that scored because of this batter's plate appearance. | SB: Bases taken while the pitcher was delivering. Being caught is counted separately. | AVG: Hits per at-bat. .300 is the traditional line between a good hitter and a great one. | OBP: Share of plate appearances that ended with the batter on base — hits, walks and hit-by-pitches. | SLG: Total bases per at-bat, so a home run counts four times a single. | OPS: On-base percentage plus slugging. Around .800 is All-Star level, .900 is MVP territory. | |||
|---|---|---|---|---|---|---|---|---|---|---|---|---|
| Oct 1, 2017 |  @ CLE | L 3-1 | 3 | 0 | 1 | 0 | 0 | 0 | .231 | .338 | .412 | .750 |
| Sep 30, 2017 | @ CLE | W 2-1 | 4 | 0 | 0 | 0 | 0 | 0 | .230 | .335 | .408 | .743 |
| Sep 29, 2017 | @ CLE | L 10-1 | 4 | 0 | 2 | 0 | 0 | 0 | .234 | .341 | .417 | .757 |
| Sep 28, 2017 |  vs LAA | W 5-4 | 3 | 0 | 0 | 0 | 0 | 0 | .229 | .338 | .415 | .753 |
| Sep 27, 2017 | vs LAA | W 6-4 F/10 | 5 | 0 | 1 | 0 | 0 | 0 | .232 | .340 | .422 | .761 |
| Sep 26, 2017 | vs LAA | L 9-3 | 3 | 0 | 0 | 0 | 0 | 0 | .233 | .343 | .428 | .771 |
| Sep 24, 2017 |  vs KC | W 8-1 | 4 | 2 | 1 | 0 | 0 | 0 | .237 | .345 | .435 | .780 |
| Sep 23, 2017 | vs KC | L 8-2 | 4 | 1 | 1 | 0 | 0 | 0 | .237 | .343 | .434 | .777 |
| Sep 22, 2017 | vs KC | W 7-6 | 4 | 1 | 1 | 1 | 2 | 0 | .237 | .345 | .438 | .783 |
| Sep 21, 2017 |  @ HOU | W 3-1 | 3 | 1 | 0 | 0 | 0 | 0 | .236 | .347 | .424 | .771 |
| Sep 20, 2017 | @ HOU | L 4-3 | 4 | 1 | 1 | 1 | 2 | 0 | .241 | .349 | .432 | .781 |
| Sep 19, 2017 | @ HOU | L 3-1 | 4 | 1 | 3 | 0 | 0 | 1 | .241 | .351 | .418 | .769 |
| Sep 17, 2017 |  @ DET | L 12-0 | 4 | 0 | 0 | 0 | 0 | 0 | .227 | .343 | .409 | .752 |
| Sep 16, 2017 | @ DET | W 10-4 | 6 | 1 | 2 | 0 | 2 | 0 | .233 | .350 | .420 | .770 |
| Sep 15, 2017 | @ DET | L 3-2 | 4 | 1 | 1 | 1 | 1 | 0 | .229 | .351 | .424 | .774 |
What the columns mean: AB · R · H · HR · RBI · SB · AVG · OBP · SLG · OPS
All 54 gamesOnly the last 15 games
| AB: At-bats: trips to the plate that ended in a hit, an out or an error. Walks and sacrifices are not counted. | R: Runs — scored by the batter, or allowed by the pitcher. | H: Times the batter reached base by hitting the ball, without help from an error. | HR: Home runs hit. | RBI: Runs that scored because of this batter's plate appearance. | SB: Bases taken while the pitcher was delivering. Being caught is counted separately. | AVG: Hits per at-bat. .300 is the traditional line between a good hitter and a great one. | OBP: Share of plate appearances that ended with the batter on base — hits, walks and hit-by-pitches. | SLG: Total bases per at-bat, so a home run counts four times a single. | OPS: On-base percentage plus slugging. Around .800 is All-Star level, .900 is MVP territory. | |||
|---|---|---|---|---|---|---|---|---|---|---|---|---|
| Oct 1, 2017 | @ CLE | L 3-1 | 3 | 0 | 1 | 0 | 0 | 0 | .231 | .338 | .412 | .750 |
| Sep 30, 2017 | @ CLE | W 2-1 | 4 | 0 | 0 | 0 | 0 | 0 | .230 | .335 | .408 | .743 |
| Sep 29, 2017 | @ CLE | L 10-1 | 4 | 0 | 2 | 0 | 0 | 0 | .234 | .341 | .417 | .757 |
| Sep 28, 2017 | vs LAA | W 5-4 | 3 | 0 | 0 | 0 | 0 | 0 | .229 | .338 | .415 | .753 |
| Sep 27, 2017 | vs LAA | W 6-4 F/10 | 5 | 0 | 1 | 0 | 0 | 0 | .232 | .340 | .422 | .761 |
| Sep 26, 2017 | vs LAA | L 9-3 | 3 | 0 | 0 | 0 | 0 | 0 | .233 | .343 | .428 | .771 |
| Sep 24, 2017 | vs KC | W 8-1 | 4 | 2 | 1 | 0 | 0 | 0 | .237 | .345 | .435 | .780 |
| Sep 23, 2017 | vs KC | L 8-2 | 4 | 1 | 1 | 0 | 0 | 0 | .237 | .343 | .434 | .777 |
| Sep 22, 2017 | vs KC | W 7-6 | 4 | 1 | 1 | 1 | 2 | 0 | .237 | .345 | .438 | .783 |
| Sep 21, 2017 | @ HOU | W 3-1 | 3 | 1 | 0 | 0 | 0 | 0 | .236 | .347 | .424 | .771 |
| Sep 20, 2017 | @ HOU | L 4-3 | 4 | 1 | 1 | 1 | 2 | 0 | .241 | .349 | .432 | .781 |
| Sep 19, 2017 | @ HOU | L 3-1 | 4 | 1 | 3 | 0 | 0 | 1 | .241 | .351 | .418 | .769 |
| Sep 17, 2017 | @ DET | L 12-0 | 4 | 0 | 0 | 0 | 0 | 0 | .227 | .343 | .409 | .752 |
| Sep 16, 2017 | @ DET | W 10-4 | 6 | 1 | 2 | 0 | 2 | 0 | .233 | .350 | .420 | .770 |
| Sep 15, 2017 | @ DET | L 3-2 | 4 | 1 | 1 | 1 | 1 | 0 | .229 | .351 | .424 | .774 |
| Sep 14, 2017 | @ DET | W 17-7 | 5 | 5 | 4 | 1 | 1 | 1 | .229 | .353 | .407 | .760 |
| Sep 13, 2017 | @ KC | W 5-3 | 3 | 1 | 2 | 0 | 0 | 0 | .207 | .331 | .370 | .702 |
| Sep 12, 2017 | @ KC | L 4-3 | 5 | 0 | 1 | 0 | 0 | 0 | .197 | .316 | .364 | .680 |
| Sep 11, 2017 | @ KC | W 11-3 | 6 | 2 | 3 | 0 | 2 | 0 | .197 | .320 | .370 | .690 |
| Sep 10, 2017 |  vs SF | W 8-1 | 4 | 0 | 1 | 0 | 0 | 0 | .182 | .313 | .347 | .660 |
| Sep 9, 2017 | vs SF | W 13-1 | 5 | 1 | 1 | 1 | 1 | 0 | .179 | .314 | .350 | .665 |
| Sep 8, 2017 | vs SF | L 9-2 | 3 | 0 | 0 | 0 | 0 | 0 | .179 | .319 | .330 | .649 |
| Sep 7, 2017 | vs CLE | L 11-2 | 3 | 0 | 0 | 0 | 0 | 0 | .183 | .321 | .339 | .660 |
| Sep 5, 2017 | vs CLE | L 9-4 | 5 | 0 | 1 | 0 | 0 | 0 | .189 | .323 | .349 | .672 |
| Aug 24, 2017 |  vs MIN | W 5-1 | 2 | 1 | 0 | 0 | 0 | 1 | .188 | .328 | .356 | .684 |
| Aug 23, 2017 | vs MIN | W 4-3 | 4 | 0 | 1 | 0 | 1 | 0 | .192 | .328 | .364 | .691 |
| Aug 22, 2017 | vs MIN | L 4-1 | 4 | 1 | 2 | 0 | 0 | 0 | .189 | .330 | .358 | .688 |
| Aug 21, 2017 | vs MIN | W 7-6 | 3 | 1 | 0 | 0 | 0 | 0 | — | — | — | — |
| Aug 18, 2017 |  @ TEX | W 4-3 | 4 | 0 | 0 | 0 | 0 | 0 | .182 | .327 | .341 | .668 |
| Aug 17, 2017 | @ TEX | L 9-8 | 3 | 2 | 1 | 1 | 1 | 0 | .190 | .333 | .357 | .690 |
| Aug 16, 2017 |  @ LAD | L 5-4 | 4 | 0 | 0 | 0 | 0 | 0 | .185 | .320 | .321 | .641 |
| Aug 15, 2017 | @ LAD | L 6-1 | 4 | 0 | 0 | 0 | 0 | 0 | .195 | .333 | .338 | .671 |
| Aug 13, 2017 | vs KC | L 14-6 | 4 | 1 | 1 | 0 | 0 | 0 | .205 | .348 | .356 | .704 |
| Aug 12, 2017 | vs KC | L 5-4 | 4 | 0 | 0 | 0 | 0 | 0 | .203 | .353 | .348 | .701 |
| Aug 11, 2017 | vs KC | W 6-3 | 4 | 0 | 1 | 0 | 0 | 0 | .215 | .370 | .369 | .740 |
| Aug 10, 2017 | vs HOU | W 3-2 F/11 | 5 | 1 | 2 | 1 | 2 | 0 | .213 | .377 | .377 | .754 |
| Aug 9, 2017 | vs HOU | W 7-1 | 2 | 1 | 1 | 0 | 0 | 0 | .196 | .366 | .321 | .688 |
| Aug 8, 2017 | vs HOU | W 8-5 | 2 | 0 | 1 | 0 | 1 | 0 | .185 | .343 | .296 | .640 |
| Aug 6, 2017 |  @ BOS | L 6-3 | 4 | 0 | 2 | 0 | 0 | 0 | .173 | .317 | .288 | .606 |
| Aug 5, 2017 | @ BOS | L 4-1 | 4 | 0 | 1 | 0 | 0 | 0 | .146 | .305 | .271 | .576 |
| Aug 4, 2017 | @ BOS | L 3-2 F/11 | 4 | 0 | 2 | 0 | 0 | 0 | .136 | .309 | .273 | .582 |
| Aug 3, 2017 | @ BOS | L 9-5 | 2 | 2 | 0 | 0 | 0 | 0 | .100 | .280 | .250 | .530 |
| Jul 31, 2017 |  vs TOR | W 7-6 | 2 | 0 | 0 | 0 | 0 | 0 | .105 | .261 | .263 | .524 |
| Jul 30, 2017 | vs CLE | W 3-1 | 2 | 0 | 0 | 0 | 0 | 0 | .111 | .273 | .278 | .551 |
| Jul 29, 2017 | vs CLE | L 5-4 | 4 | 0 | 0 | 0 | 0 | 0 | .118 | .268 | .294 | .562 |
| Jul 28, 2017 | vs CLE | L 9-3 | 3 | 1 | 1 | 0 | 1 | 0 | .133 | .278 | .333 | .611 |
| Jul 27, 2017 |  vs CHC | L 6-3 | 4 | 0 | 0 | 0 | 0 | 0 | .111 | .250 | .296 | .546 |
| Jul 26, 2017 | vs CHC | L 8-3 | 3 | 2 | 1 | 1 | 1 | 0 | .130 | .286 | .348 | .634 |
| Jul 25, 2017 | @ CHC | L 7-2 | 2 | 0 | 0 | 0 | 0 | 0 | .100 | .250 | .200 | .450 |
| Jul 24, 2017 | @ CHC | W 3-1 | 5 | 0 | 1 | 0 | 0 | 0 | .111 | .200 | .222 | .422 |
| Jul 23, 2017 | @ KC | L 5-4 | 4 | 0 | 0 | 0 | 0 | 0 | .077 | .200 | .231 | .431 |
| Jul 22, 2017 | @ KC | L 7-2 | 3 | 0 | 0 | 0 | 0 | 0 | .111 | .273 | .333 | .606 |
| Jul 21, 2017 | @ KC | L 7-6 F/10 | 4 | 0 | 1 | 0 | 4 | 0 | .167 | .286 | .500 | .786 |
| Jul 19, 2017 | vs LAD | L 9-1 F/8 | 2 | 0 | 0 | 0 | 0 | 0 | .000 | .333 | .000 | .333 |
What the columns mean: AB · R · H · HR · RBI · SB · AVG · OBP · SLG · OPS
Answered about Yoan Moncada in 2017
Source: ESPN public MLB data, 2017 season.