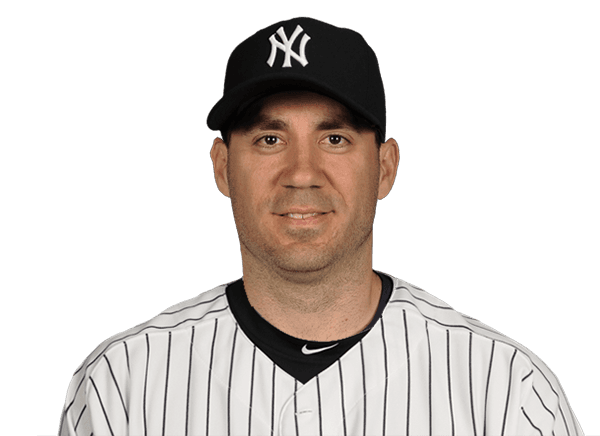
Travis Hafner 2013 season stats
Yankees
Travis Hafner played 82 games for the New York Yankees in the 2013 MLB regular season, with a .202 batting average, 12 home runs and 37 RBI.
2013 season stats
2013 regular season Yankees
- GP
- 82
- AB
- 262
- R
- 31
- H
- 53
- HR
- 12
- RBI
- 37
- SB
- 2
- AVG
- .202
- OBP
- .301
- SLG
- .378
- OPS
- .679
- 2B
- 8
Against other designated hitters
2013 regular season, 35 MLB designated hitters with 25+ games.
- Home Runs12
Higher than 32% of the other 34 MLB designated hitters.
- Batting Average.202
Higher than 3% of the other 34 MLB designated hitters.
- RBI37
Higher than 26% of the other 34 MLB designated hitters.
2013 splits
Totals, from the 82 regular-season games in the log.
By opponent
2013 game log
| AB: At-bats: trips to the plate that ended in a hit, an out or an error. Walks and sacrifices are not counted. | R: Runs — scored by the batter, or allowed by the pitcher. | H: Times the batter reached base by hitting the ball, without help from an error. | HR: Home runs hit. | RBI: Runs that scored because of this batter's plate appearance. | SB: Bases taken while the pitcher was delivering. Being caught is counted separately. | AVG: Hits per at-bat. .300 is the traditional line between a good hitter and a great one. | OBP: Share of plate appearances that ended with the batter on base — hits, walks and hit-by-pitches. | SLG: Total bases per at-bat, so a home run counts four times a single. | OPS: On-base percentage plus slugging. Around .800 is All-Star level, .900 is MVP territory. | |||
|---|---|---|---|---|---|---|---|---|---|---|---|---|
| Sep 29, 2013 |  @ HOU | W 5-1 F/14 | 4 | 0 | 0 | 0 | 0 | 0 | .202 | .301 | .378 | .679 |
| Jul 26, 2013 |  vs TB | L 10-6 | 4 | 0 | 0 | 0 | 0 | 0 | .205 | .300 | .384 | .684 |
| Jul 24, 2013 |  @ TEX | L 3-1 | 1 | 0 | 0 | 0 | 0 | 0 | .209 | .304 | .390 | .694 |
| Jul 23, 2013 | @ TEX | W 5-4 | 1 | 0 | 0 | 0 | 0 | 0 | .209 | .306 | .391 | .697 |
| Jul 22, 2013 | @ TEX | L 3-0 | 2 | 0 | 0 | 0 | 0 | 0 | .210 | .307 | .393 | .699 |
| Jul 21, 2013 |  @ BOS | L 8-7 F/11 | 3 | 0 | 0 | 0 | 0 | 0 | .212 | .306 | .396 | .702 |
| Jul 20, 2013 | @ BOS | W 5-2 | 4 | 0 | 0 | 0 | 0 | 0 | .215 | .310 | .401 | .710 |
| Jul 14, 2013 |  vs MIN | L 10-4 | 5 | 0 | 1 | 0 | 0 | 0 | .218 | .314 | .407 | .721 |
| Jul 13, 2013 | vs MIN | L 4-1 | 1 | 0 | 1 | 0 | 0 | 0 | .218 | .316 | .412 | .728 |
| Jul 10, 2013 |  vs KC | W 8-1 | 2 | 0 | 0 | 0 | 0 | 0 | .215 | .314 | .405 | .719 |
| Jul 9, 2013 | vs KC | L 3-1 | 3 | 0 | 0 | 0 | 0 | 0 | .217 | .316 | .409 | .724 |
| Jul 8, 2013 | vs KC | L 5-1 | 4 | 0 | 0 | 0 | 0 | 0 | .220 | .317 | .414 | .731 |
| Jul 7, 2013 |  vs BAL | L 2-1 | 3 | 0 | 1 | 0 | 0 | 0 | .224 | .322 | .421 | .743 |
| Jul 6, 2013 | vs BAL | W 5-4 | 3 | 1 | 0 | 0 | 0 | 0 | .222 | .322 | .422 | .744 |
| Jul 5, 2013 | vs BAL | W 3-2 | 4 | 0 | 0 | 0 | 1 | 0 | .225 | .323 | .428 | .751 |
What the columns mean: AB · R · H · HR · RBI · SB · AVG · OBP · SLG · OPS
All 82 gamesOnly the last 15 games
| AB: At-bats: trips to the plate that ended in a hit, an out or an error. Walks and sacrifices are not counted. | R: Runs — scored by the batter, or allowed by the pitcher. | H: Times the batter reached base by hitting the ball, without help from an error. | HR: Home runs hit. | RBI: Runs that scored because of this batter's plate appearance. | SB: Bases taken while the pitcher was delivering. Being caught is counted separately. | AVG: Hits per at-bat. .300 is the traditional line between a good hitter and a great one. | OBP: Share of plate appearances that ended with the batter on base — hits, walks and hit-by-pitches. | SLG: Total bases per at-bat, so a home run counts four times a single. | OPS: On-base percentage plus slugging. Around .800 is All-Star level, .900 is MVP territory. | |||
|---|---|---|---|---|---|---|---|---|---|---|---|---|
| Sep 29, 2013 | @ HOU | W 5-1 F/14 | 4 | 0 | 0 | 0 | 0 | 0 | .202 | .301 | .378 | .679 |
| Jul 26, 2013 | vs TB | L 10-6 | 4 | 0 | 0 | 0 | 0 | 0 | .205 | .300 | .384 | .684 |
| Jul 24, 2013 | @ TEX | L 3-1 | 1 | 0 | 0 | 0 | 0 | 0 | .209 | .304 | .390 | .694 |
| Jul 23, 2013 | @ TEX | W 5-4 | 1 | 0 | 0 | 0 | 0 | 0 | .209 | .306 | .391 | .697 |
| Jul 22, 2013 | @ TEX | L 3-0 | 2 | 0 | 0 | 0 | 0 | 0 | .210 | .307 | .393 | .699 |
| Jul 21, 2013 | @ BOS | L 8-7 F/11 | 3 | 0 | 0 | 0 | 0 | 0 | .212 | .306 | .396 | .702 |
| Jul 20, 2013 | @ BOS | W 5-2 | 4 | 0 | 0 | 0 | 0 | 0 | .215 | .310 | .401 | .710 |
| Jul 14, 2013 | vs MIN | L 10-4 | 5 | 0 | 1 | 0 | 0 | 0 | .218 | .314 | .407 | .721 |
| Jul 13, 2013 | vs MIN | L 4-1 | 1 | 0 | 1 | 0 | 0 | 0 | .218 | .316 | .412 | .728 |
| Jul 10, 2013 | vs KC | W 8-1 | 2 | 0 | 0 | 0 | 0 | 0 | .215 | .314 | .405 | .719 |
| Jul 9, 2013 | vs KC | L 3-1 | 3 | 0 | 0 | 0 | 0 | 0 | .217 | .316 | .409 | .724 |
| Jul 8, 2013 | vs KC | L 5-1 | 4 | 0 | 0 | 0 | 0 | 0 | .220 | .317 | .414 | .731 |
| Jul 7, 2013 | vs BAL | L 2-1 | 3 | 0 | 1 | 0 | 0 | 0 | .224 | .322 | .421 | .743 |
| Jul 6, 2013 | vs BAL | W 5-4 | 3 | 1 | 0 | 0 | 0 | 0 | .222 | .322 | .422 | .744 |
| Jul 5, 2013 | vs BAL | W 3-2 | 4 | 0 | 0 | 0 | 1 | 0 | .225 | .323 | .428 | .751 |
| Jul 4, 2013 | @ MIN | W 9-5 | 4 | 2 | 3 | 0 | 0 | 0 | .229 | .325 | .436 | .761 |
| Jul 3, 2013 | @ MIN | W 3-2 | 4 | 0 | 1 | 0 | 0 | 0 | .220 | .316 | .421 | .736 |
| Jul 2, 2013 | @ MIN | W 7-3 | 4 | 0 | 0 | 0 | 0 | 0 | .219 | .317 | .424 | .740 |
| Jul 1, 2013 | @ MIN | W 10-4 | 4 | 1 | 1 | 0 | 1 | 0 | .223 | .322 | .432 | .754 |
| Jun 30, 2013 | @ BAL | L 4-2 | 3 | 0 | 1 | 0 | 0 | 0 | .223 | .320 | .436 | .756 |
| Jun 29, 2013 | @ BAL | L 11-3 | 1 | 0 | 0 | 0 | 0 | 0 | .221 | .320 | .437 | .757 |
| Jun 28, 2013 | @ BAL | L 4-3 | 1 | 0 | 0 | 0 | 0 | 0 | .222 | .322 | .439 | .761 |
| Jun 26, 2013 | vs TEX | L 8-5 | 4 | 0 | 1 | 0 | 1 | 0 | .223 | .323 | .442 | .765 |
| Jun 25, 2013 | vs TEX | W 4-3 | 4 | 1 | 2 | 1 | 1 | 0 | .223 | .324 | .446 | .770 |
| Jun 23, 2013 | vs TB | L 3-1 | 4 | 0 | 1 | 0 | 0 | 0 | .217 | .321 | .429 | .750 |
| Jun 22, 2013 | vs TB | W 7-5 | 5 | 0 | 1 | 0 | 0 | 0 | .216 | .322 | .432 | .755 |
| Jun 21, 2013 | vs TB | W 6-2 | 4 | 1 | 1 | 0 | 0 | 0 | .217 | .325 | .439 | .764 |
| Jun 20, 2013 | vs TB | L 8-3 | 4 | 0 | 0 | 0 | 1 | 0 | .216 | .327 | .443 | .770 |
| Jun 16, 2013 |  @ LAA | W 6-5 | 3 | 1 | 1 | 1 | 3 | 0 | .221 | .333 | .453 | .787 |
| Jun 14, 2013 | @ LAA | L 5-2 | 1 | 0 | 0 | 0 | 0 | 0 | .219 | .330 | .438 | .768 |
| Jun 13, 2013 |  @ ATH | L 3-2 F/18 | 8 | 0 | 0 | 0 | 0 | 0 | .220 | .332 | .440 | .772 |
| Jun 12, 2013 | @ ATH | L 5-2 | 4 | 0 | 0 | 0 | 0 | 0 | .231 | .346 | .463 | .808 |
| Jun 11, 2013 | @ ATH | L 6-4 | 3 | 0 | 0 | 0 | 0 | 0 | .237 | .353 | .474 | .828 |
| Jun 9, 2013 |  @ SEA | W 2-1 | 3 | 0 | 0 | 0 | 0 | 0 | .242 | .352 | .484 | .836 |
| Jun 7, 2013 | @ SEA | L 4-1 | 4 | 0 | 0 | 0 | 1 | 0 | .247 | .354 | .493 | .848 |
| Jun 6, 2013 | @ SEA | W 6-1 | 4 | 1 | 2 | 0 | 0 | 0 | .253 | .363 | .507 | .869 |
| Jun 5, 2013 |  vs CLE | W 6-4 | 3 | 1 | 1 | 1 | 2 | 0 | .246 | .359 | .507 | .866 |
| Jun 3, 2013 | vs CLE | W 7-4 | 4 | 1 | 1 | 1 | 1 | 0 | .245 | .356 | .489 | .845 |
| Jun 2, 2013 | vs BOS | L 3-0 F/6 | 2 | 0 | 0 | 0 | 0 | 0 | .244 | .358 | .474 | .833 |
| May 30, 2013 |  vs NYM | L 3-1 | 4 | 0 | 0 | 0 | 0 | 0 | .248 | .363 | .481 | .844 |
| May 29, 2013 | vs NYM | L 9-4 | 5 | 1 | 1 | 0 | 0 | 0 | .256 | .373 | .496 | .869 |
| May 28, 2013 | @ NYM | L 2-1 | 1 | 0 | 0 | 0 | 0 | 0 | .258 | .378 | .508 | .886 |
| May 27, 2013 | @ NYM | L 2-1 | 1 | 0 | 0 | 0 | 0 | 0 | .260 | .381 | .512 | .893 |
| May 26, 2013 | @ TB | L 8-3 | 3 | 1 | 0 | 0 | 0 | 0 | .262 | .384 | .516 | .900 |
| May 25, 2013 | @ TB | W 4-3 F/11 | 4 | 0 | 1 | 0 | 1 | 0 | .269 | .387 | .529 | .917 |
| May 24, 2013 | @ TB | W 9-4 | 4 | 1 | 1 | 0 | 0 | 0 | .270 | .387 | .539 | .926 |
| May 22, 2013 | @ BAL | L 6-3 | 2 | 0 | 0 | 0 | 0 | 0 | .270 | .386 | .541 | .927 |
| May 21, 2013 | @ BAL | L 3-2 F/10 | 4 | 0 | 2 | 0 | 2 | 0 | .275 | .383 | .550 | .933 |
| May 20, 2013 | @ BAL | W 6-4 F/10 | 5 | 1 | 2 | 1 | 2 | 1 | .267 | .379 | .552 | .931 |
| May 18, 2013 |  vs TOR | W 7-2 | 4 | 1 | 1 | 1 | 2 | 0 | .260 | .378 | .530 | .908 |
| May 13, 2013 | @ CLE | L 1-0 | 3 | 0 | 0 | 0 | 0 | 0 | .260 | .383 | .510 | .893 |
| May 12, 2013 | @ KC | W 4-2 | 4 | 0 | 1 | 0 | 0 | 0 | .269 | .387 | .527 | .914 |
| May 11, 2013 | @ KC | W 3-2 | 4 | 0 | 1 | 0 | 0 | 0 | .270 | .393 | .528 | .921 |
| May 10, 2013 | @ KC | W 11-6 | 4 | 1 | 0 | 0 | 0 | 0 | .271 | .398 | .541 | .939 |
| May 8, 2013 |  @ COL | W 3-2 | 1 | 0 | 0 | 0 | 0 | 0 | .284 | .408 | .568 | .976 |
| May 7, 2013 | @ COL | L 2-0 | 1 | 0 | 0 | 0 | 0 | 0 | .288 | .412 | .575 | .987 |
| May 5, 2013 | vs ATH | L 5-4 | 2 | 1 | 1 | 0 | 0 | 0 | .291 | .417 | .582 | .999 |
| May 4, 2013 | vs ATH | W 4-2 | 4 | 0 | 1 | 0 | 1 | 0 | .286 | .402 | .584 | .987 |
| May 3, 2013 | vs ATH | L 2-0 | 4 | 0 | 0 | 0 | 0 | 0 | .288 | .409 | .603 | 1.012 |
| May 1, 2013 | vs HOU | W 5-4 | 3 | 1 | 0 | 0 | 0 | 0 | .304 | .429 | .638 | 1.066 |
| Apr 30, 2013 | vs HOU | W 7-4 | 4 | 0 | 3 | 0 | 3 | 0 | .318 | .438 | .667 | 1.104 |
| Apr 29, 2013 | vs HOU | L 9-1 | 3 | 0 | 0 | 0 | 0 | 0 | .290 | .413 | .661 | 1.075 |
| Apr 28, 2013 | vs TOR | W 3-2 | 4 | 1 | 1 | 0 | 0 | 0 | .305 | .423 | .695 | 1.117 |
| Apr 27, 2013 | vs TOR | W 5-4 | 4 | 1 | 2 | 1 | 4 | 0 | .309 | .433 | .727 | 1.160 |
| Apr 26, 2013 | vs TOR | W 6-4 | 1 | 0 | 0 | 0 | 0 | 0 | .294 | .429 | .647 | 1.076 |
| Apr 24, 2013 | @ TB | L 3-0 | 3 | 0 | 0 | 0 | 0 | 0 | .300 | .417 | .660 | 1.077 |
| Apr 23, 2013 | @ TB | W 4-3 | 0 | 1 | 0 | 0 | 0 | 0 | .319 | .429 | .702 | 1.131 |
| Apr 21, 2013 | @ TOR | L 8-4 | 4 | 0 | 0 | 0 | 0 | 1 | .319 | .418 | .702 | 1.120 |
| Apr 19, 2013 | @ TOR | W 9-4 | 5 | 1 | 2 | 1 | 2 | 0 | .349 | .440 | .767 | 1.207 |
| Apr 18, 2013 |  vs ARI | L 6-2 F/12 | 0 | 0 | 0 | 0 | 0 | 0 | .342 | .444 | .711 | 1.155 |
| Apr 17, 2013 | vs ARI | W 4-3 | 1 | 1 | 1 | 1 | 1 | 0 | .342 | .432 | .711 | 1.142 |
| Apr 16, 2013 | vs ARI | W 4-2 | 4 | 0 | 2 | 0 | 0 | 0 | .324 | .419 | .622 | 1.040 |
| Apr 13, 2013 | vs BAL | L 5-3 | 4 | 1 | 1 | 1 | 1 | 0 | .303 | .410 | .576 | .986 |
| Apr 12, 2013 | vs BAL | W 5-2 | 2 | 1 | 0 | 0 | 0 | 0 | .310 | .429 | .517 | .946 |
| Apr 9, 2013 | @ CLE | W 14-1 | 4 | 0 | 0 | 0 | 0 | 0 | .333 | .419 | .556 | .975 |
| Apr 8, 2013 | @ CLE | W 11-6 | 3 | 3 | 2 | 1 | 4 | 0 | .391 | .481 | .652 | 1.134 |
| Apr 7, 2013 |  @ DET | W 7-0 | 4 | 0 | 2 | 0 | 0 | 0 | .350 | .409 | .500 | .909 |
| Apr 6, 2013 | @ DET | L 8-4 | 3 | 1 | 1 | 0 | 1 | 0 | .313 | .389 | .500 | .889 |
| Apr 5, 2013 | @ DET | L 8-3 | 3 | 0 | 1 | 0 | 0 | 0 | .308 | .357 | .538 | .896 |
| Apr 4, 2013 | vs BOS | W 4-2 | 4 | 1 | 1 | 0 | 0 | 0 | .300 | .300 | .600 | .900 |
| Apr 3, 2013 | vs BOS | L 7-4 | 4 | 1 | 1 | 1 | 1 | 0 | .333 | .333 | .833 | 1.167 |
| Apr 1, 2013 | vs BOS | L 8-2 | 2 | 0 | 1 | 0 | 0 | 0 | .500 | .500 | .500 | 1.000 |
What the columns mean: AB · R · H · HR · RBI · SB · AVG · OBP · SLG · OPS
Answered about Travis Hafner in 2013
Source: ESPN public MLB data, 2013 season.