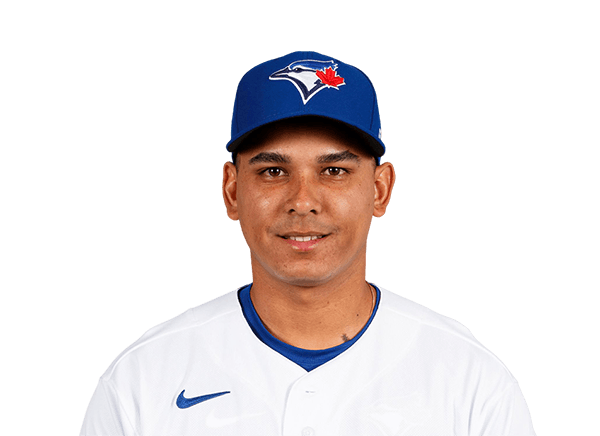
Ruben Tejada 2017 season stats
Orioles
Ruben Tejada played 41 games for the Baltimore Orioles in the 2017 MLB regular season, with a .230 batting average, 0 home runs and 5 RBI.
2017 season stats
2017 regular season Orioles
- GP
- 41
- AB
- 113
- R
- 17
- H
- 26
- HR
- 0
- RBI
- 5
- SB
- 0
- AVG
- .230
- OBP
- .293
- SLG
- .283
- OPS
- .576
- 2B
- 6
2017 splits
Totals, from the 41 regular-season games in the log.
By opponent
2017 game log
| AB: At-bats: trips to the plate that ended in a hit, an out or an error. Walks and sacrifices are not counted. | R: Runs — scored by the batter, or allowed by the pitcher. | H: Times the batter reached base by hitting the ball, without help from an error. | HR: Home runs hit. | RBI: Runs that scored because of this batter's plate appearance. | SB: Bases taken while the pitcher was delivering. Being caught is counted separately. | AVG: Hits per at-bat. .300 is the traditional line between a good hitter and a great one. | OBP: Share of plate appearances that ended with the batter on base — hits, walks and hit-by-pitches. | SLG: Total bases per at-bat, so a home run counts four times a single. | OPS: On-base percentage plus slugging. Around .800 is All-Star level, .900 is MVP territory. | |||
|---|---|---|---|---|---|---|---|---|---|---|---|---|
| Aug 14, 2017 |  @ SEA | W 11-3 | 0 | 0 | 0 | 0 | 0 | 0 | .230 | .293 | .283 | .576 |
| Aug 6, 2017 |  vs DET | W 12-3 | 0 | 0 | 0 | 0 | 0 | 0 | .230 | .293 | .283 | .576 |
| Jul 31, 2017 |  vs KC | W 2-1 | 3 | 0 | 1 | 0 | 0 | 0 | .230 | .293 | .283 | .576 |
| Jul 30, 2017 |  @ TEX | W 10-6 | 4 | 0 | 0 | 0 | 1 | 0 | .227 | .286 | .282 | .568 |
| Jul 29, 2017 | @ TEX | W 4-0 | 3 | 0 | 0 | 0 | 0 | 0 | .236 | .296 | .292 | .588 |
| Jul 28, 2017 | @ TEX | L 8-2 | 3 | 0 | 0 | 0 | 0 | 0 | .243 | .297 | .301 | .598 |
| Jul 26, 2017 |  @ TB | L 5-1 | 3 | 0 | 0 | 0 | 0 | 0 | .250 | .306 | .310 | .616 |
| Jul 25, 2017 | @ TB | L 5-4 | 3 | 0 | 0 | 0 | 0 | 0 | .258 | .314 | .320 | .634 |
| Jul 24, 2017 | @ TB | W 5-0 | 4 | 1 | 1 | 0 | 0 | 0 | .266 | .324 | .330 | .653 |
| Jul 23, 2017 |  vs HOU | W 9-7 | 3 | 1 | 1 | 0 | 0 | 0 | .267 | .327 | .333 | .660 |
| Jul 22, 2017 | vs HOU | L 8-4 | 3 | 0 | 0 | 0 | 0 | 0 | .264 | .319 | .322 | .641 |
| Jul 21, 2017 | vs HOU | L 8-7 | 3 | 2 | 1 | 0 | 0 | 0 | .274 | .330 | .333 | .663 |
| Jul 20, 2017 | vs TEX | W 9-7 | 4 | 1 | 3 | 0 | 0 | 0 | .272 | .322 | .333 | .655 |
| Jul 19, 2017 | vs TEX | W 10-2 | 4 | 1 | 0 | 0 | 0 | 0 | .247 | .301 | .299 | .600 |
| Jul 18, 2017 | vs TEX | W 12-1 | 5 | 1 | 3 | 0 | 0 | 0 | .260 | .316 | .315 | .632 |
What the columns mean: AB · R · H · HR · RBI · SB · AVG · OBP · SLG · OPS
All 41 gamesOnly the last 15 games
| AB: At-bats: trips to the plate that ended in a hit, an out or an error. Walks and sacrifices are not counted. | R: Runs — scored by the batter, or allowed by the pitcher. | H: Times the batter reached base by hitting the ball, without help from an error. | HR: Home runs hit. | RBI: Runs that scored because of this batter's plate appearance. | SB: Bases taken while the pitcher was delivering. Being caught is counted separately. | AVG: Hits per at-bat. .300 is the traditional line between a good hitter and a great one. | OBP: Share of plate appearances that ended with the batter on base — hits, walks and hit-by-pitches. | SLG: Total bases per at-bat, so a home run counts four times a single. | OPS: On-base percentage plus slugging. Around .800 is All-Star level, .900 is MVP territory. | |||
|---|---|---|---|---|---|---|---|---|---|---|---|---|
| Aug 14, 2017 | @ SEA | W 11-3 | 0 | 0 | 0 | 0 | 0 | 0 | .230 | .293 | .283 | .576 |
| Aug 6, 2017 | vs DET | W 12-3 | 0 | 0 | 0 | 0 | 0 | 0 | .230 | .293 | .283 | .576 |
| Jul 31, 2017 | vs KC | W 2-1 | 3 | 0 | 1 | 0 | 0 | 0 | .230 | .293 | .283 | .576 |
| Jul 30, 2017 | @ TEX | W 10-6 | 4 | 0 | 0 | 0 | 1 | 0 | .227 | .286 | .282 | .568 |
| Jul 29, 2017 | @ TEX | W 4-0 | 3 | 0 | 0 | 0 | 0 | 0 | .236 | .296 | .292 | .588 |
| Jul 28, 2017 | @ TEX | L 8-2 | 3 | 0 | 0 | 0 | 0 | 0 | .243 | .297 | .301 | .598 |
| Jul 26, 2017 | @ TB | L 5-1 | 3 | 0 | 0 | 0 | 0 | 0 | .250 | .306 | .310 | .616 |
| Jul 25, 2017 | @ TB | L 5-4 | 3 | 0 | 0 | 0 | 0 | 0 | .258 | .314 | .320 | .634 |
| Jul 24, 2017 | @ TB | W 5-0 | 4 | 1 | 1 | 0 | 0 | 0 | .266 | .324 | .330 | .653 |
| Jul 23, 2017 | vs HOU | W 9-7 | 3 | 1 | 1 | 0 | 0 | 0 | .267 | .327 | .333 | .660 |
| Jul 22, 2017 | vs HOU | L 8-4 | 3 | 0 | 0 | 0 | 0 | 0 | .264 | .319 | .322 | .641 |
| Jul 21, 2017 | vs HOU | L 8-7 | 3 | 2 | 1 | 0 | 0 | 0 | .274 | .330 | .333 | .663 |
| Jul 20, 2017 | vs TEX | W 9-7 | 4 | 1 | 3 | 0 | 0 | 0 | .272 | .322 | .333 | .655 |
| Jul 19, 2017 | vs TEX | W 10-2 | 4 | 1 | 0 | 0 | 0 | 0 | .247 | .301 | .299 | .600 |
| Jul 18, 2017 | vs TEX | W 12-1 | 5 | 1 | 3 | 0 | 0 | 0 | .260 | .316 | .315 | .632 |
| Jul 17, 2017 | vs TEX | W 3-1 | 3 | 0 | 1 | 0 | 1 | 0 | .235 | .297 | .279 | .577 |
| Jul 15, 2017 |  vs CHC | L 10-3 | 3 | 0 | 1 | 0 | 1 | 0 | .231 | .296 | .277 | .573 |
| Jul 14, 2017 | vs CHC | L 9-8 | 3 | 0 | 0 | 0 | 0 | 0 | .226 | .294 | .274 | .568 |
| Jul 9, 2017 |  @ MIN | W 11-5 | 3 | 1 | 3 | 0 | 1 | 0 | .237 | .297 | .288 | .585 |
| Jul 8, 2017 | @ MIN | W 5-1 | 0 | 0 | 0 | 0 | 0 | 0 | .196 | .262 | .232 | .494 |
| Jul 7, 2017 | @ MIN | L 9-6 | 2 | 1 | 0 | 0 | 0 | 0 | .196 | .262 | .232 | .494 |
| Jul 5, 2017 |  @ MIL | L 4-0 | 4 | 0 | 0 | 0 | 0 | 0 | .204 | .259 | .241 | .499 |
| Jul 3, 2017 | @ MIL | L 8-1 | 3 | 1 | 1 | 0 | 0 | 0 | .220 | .278 | .260 | .538 |
| Jul 2, 2017 | vs TB | W 7-1 | 3 | 2 | 1 | 0 | 0 | 0 | .213 | .275 | .255 | .530 |
| Jul 1, 2017 | vs TB | L 10-3 | 4 | 1 | 2 | 0 | 0 | 0 | .205 | .255 | .250 | .505 |
| Jun 30, 2017 | vs TB | L 6-4 F/10 | 3 | 0 | 0 | 0 | 0 | 0 | .175 | .233 | .225 | .458 |
| Jun 29, 2017 |  @ TOR | W 2-0 | 4 | 1 | 1 | 0 | 0 | 0 | .189 | .250 | .243 | .493 |
| Jun 25, 2017 | @ TB | W 8-5 | 0 | 0 | 0 | 0 | 0 | 0 | .182 | .250 | .242 | .492 |
| Jun 23, 2017 | @ TB | L 15-5 | 3 | 0 | 0 | 0 | 0 | 0 | .182 | .250 | .242 | .492 |
| Jun 22, 2017 |  vs CLE | L 6-3 | 2 | 1 | 0 | 0 | 0 | 0 | .200 | .250 | .267 | .517 |
| Jun 21, 2017 | vs CLE | L 5-1 | 2 | 0 | 0 | 0 | 0 | 0 | .214 | .241 | .286 | .527 |
| Jun 20, 2017 | vs CLE | W 6-5 | 3 | 1 | 1 | 0 | 0 | 0 | .231 | .259 | .308 | .567 |
| Jun 19, 2017 | vs CLE | L 12-0 | 3 | 0 | 0 | 0 | 0 | 0 | .217 | .250 | .304 | .554 |
| Jun 18, 2017 |  vs STL | W 8-5 | 2 | 0 | 0 | 0 | 0 | 0 | .250 | .286 | .350 | .636 |
| Jun 17, 2017 | vs STL | W 15-7 | 0 | 0 | 0 | 0 | 0 | 0 | .278 | .316 | .389 | .705 |
| Jun 16, 2017 | vs STL | L 11-2 | 1 | 0 | 0 | 0 | 0 | 0 | .278 | .316 | .389 | .705 |
| Jun 15, 2017 |  @ CHW | L 5-2 | 4 | 0 | 1 | 0 | 0 | 0 | .294 | .333 | .412 | .745 |
| Jun 11, 2017 |  @ NYY | L 14-3 | 4 | 1 | 2 | 0 | 1 | 0 | .308 | .357 | .462 | .819 |
| Jun 10, 2017 | @ NYY | L 16-3 | 2 | 0 | 0 | 0 | 0 | 0 | .222 | .300 | .333 | .633 |
| Jun 9, 2017 | @ NYY | L 8-2 | 3 | 0 | 2 | 0 | 0 | 0 | .286 | .286 | .429 | .714 |
| Jun 7, 2017 |  vs PIT | W 9-6 F/11 | 4 | 0 | 0 | 0 | 0 | 0 | .000 | .000 | .000 | .000 |
What the columns mean: AB · R · H · HR · RBI · SB · AVG · OBP · SLG · OPS
Answered about Ruben Tejada in 2017
Source: ESPN public MLB data, 2017 season.