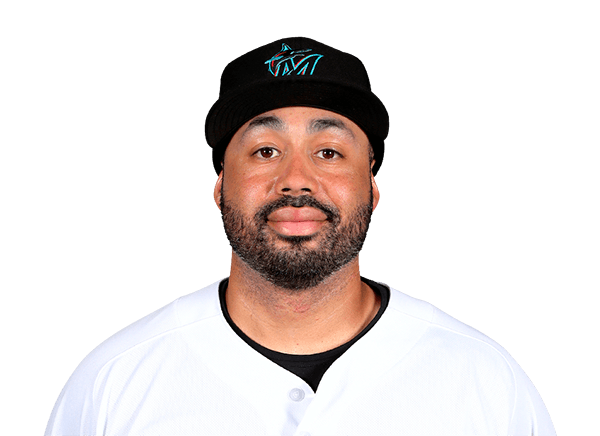
Pedro Alvarez 2018 season stats
Orioles
Pedro Alvarez played 45 games for the Baltimore Orioles in the 2018 MLB regular season, with a .180 batting average, 8 home runs and 18 RBI.
2018 season stats
2018 regular season Orioles
- GP
- 45
- AB
- 111
- R
- 18
- H
- 20
- HR
- 8
- RBI
- 18
- SB
- 0
- AVG
- .180
- OBP
- .283
- SLG
- .414
- OPS
- .698
- 2B
- 2
2018 splits
Totals, from the 45 regular-season games in the log.
By opponent
2018 game log
| AB: At-bats: trips to the plate that ended in a hit, an out or an error. Walks and sacrifices are not counted. | R: Runs — scored by the batter, or allowed by the pitcher. | H: Times the batter reached base by hitting the ball, without help from an error. | HR: Home runs hit. | RBI: Runs that scored because of this batter's plate appearance. | SB: Bases taken while the pitcher was delivering. Being caught is counted separately. | AVG: Hits per at-bat. .300 is the traditional line between a good hitter and a great one. | OBP: Share of plate appearances that ended with the batter on base — hits, walks and hit-by-pitches. | SLG: Total bases per at-bat, so a home run counts four times a single. | OPS: On-base percentage plus slugging. Around .800 is All-Star level, .900 is MVP territory. | |||
|---|---|---|---|---|---|---|---|---|---|---|---|---|
| Jun 15, 2018 |  vs MIA | L 2-0 | 3 | 0 | 0 | 0 | 0 | 0 | .180 | .283 | .414 | .698 |
| Jun 12, 2018 |  vs BOS | L 6-4 | 1 | 0 | 0 | 0 | 0 | 0 | .185 | .290 | .426 | .716 |
| Jun 11, 2018 | vs BOS | L 2-0 F/12 | 1 | 0 | 0 | 0 | 0 | 0 | .187 | .293 | .430 | .723 |
| Jun 10, 2018 |  @ TOR | L 13-3 | 1 | 0 | 0 | 0 | 0 | 0 | .189 | .295 | .434 | .729 |
| Jun 9, 2018 | @ TOR | L 4-3 F/10 | 3 | 0 | 0 | 0 | 0 | 0 | .190 | .298 | .438 | .736 |
| Jun 6, 2018 |  @ NYM | W 1-0 | 1 | 0 | 1 | 0 | 0 | 0 | .196 | .305 | .451 | .756 |
| Jun 1, 2018 |  vs NYY | L 4-1 | 1 | 0 | 0 | 0 | 0 | 0 | .188 | .299 | .446 | .745 |
| May 29, 2018 |  vs WSH | L 3-2 | 3 | 0 | 0 | 0 | 0 | 0 | .190 | .302 | .450 | .752 |
| May 27, 2018 |  @ TB | L 8-3 | 4 | 1 | 0 | 0 | 0 | 0 | .196 | .310 | .464 | .774 |
| May 24, 2018 |  @ CHW | W 9-3 | 4 | 1 | 2 | 0 | 2 | 0 | .204 | .315 | .484 | .799 |
| May 23, 2018 | @ CHW | L 11-1 | 0 | 0 | 0 | 0 | 0 | 0 | .191 | .301 | .483 | .784 |
| May 22, 2018 | @ CHW | L 3-2 | 3 | 1 | 0 | 0 | 0 | 0 | .191 | .301 | .483 | .784 |
| May 19, 2018 | @ BOS | L 6-3 | 3 | 1 | 1 | 1 | 2 | 0 | .198 | .303 | .500 | .803 |
| May 16, 2018 |  vs PHI | L 4-1 | 3 | 0 | 0 | 0 | 0 | 0 | .193 | .295 | .470 | .765 |
| May 10, 2018 |  vs KC | W 11-6 | 2 | 1 | 0 | 0 | 0 | 0 | .200 | .304 | .488 | .792 |
What the columns mean: AB · R · H · HR · RBI · SB · AVG · OBP · SLG · OPS
All 45 gamesOnly the last 15 games
| AB: At-bats: trips to the plate that ended in a hit, an out or an error. Walks and sacrifices are not counted. | R: Runs — scored by the batter, or allowed by the pitcher. | H: Times the batter reached base by hitting the ball, without help from an error. | HR: Home runs hit. | RBI: Runs that scored because of this batter's plate appearance. | SB: Bases taken while the pitcher was delivering. Being caught is counted separately. | AVG: Hits per at-bat. .300 is the traditional line between a good hitter and a great one. | OBP: Share of plate appearances that ended with the batter on base — hits, walks and hit-by-pitches. | SLG: Total bases per at-bat, so a home run counts four times a single. | OPS: On-base percentage plus slugging. Around .800 is All-Star level, .900 is MVP territory. | |||
|---|---|---|---|---|---|---|---|---|---|---|---|---|
| Jun 15, 2018 | vs MIA | L 2-0 | 3 | 0 | 0 | 0 | 0 | 0 | .180 | .283 | .414 | .698 |
| Jun 12, 2018 | vs BOS | L 6-4 | 1 | 0 | 0 | 0 | 0 | 0 | .185 | .290 | .426 | .716 |
| Jun 11, 2018 | vs BOS | L 2-0 F/12 | 1 | 0 | 0 | 0 | 0 | 0 | .187 | .293 | .430 | .723 |
| Jun 10, 2018 | @ TOR | L 13-3 | 1 | 0 | 0 | 0 | 0 | 0 | .189 | .295 | .434 | .729 |
| Jun 9, 2018 | @ TOR | L 4-3 F/10 | 3 | 0 | 0 | 0 | 0 | 0 | .190 | .298 | .438 | .736 |
| Jun 6, 2018 | @ NYM | W 1-0 | 1 | 0 | 1 | 0 | 0 | 0 | .196 | .305 | .451 | .756 |
| Jun 1, 2018 | vs NYY | L 4-1 | 1 | 0 | 0 | 0 | 0 | 0 | .188 | .299 | .446 | .745 |
| May 29, 2018 | vs WSH | L 3-2 | 3 | 0 | 0 | 0 | 0 | 0 | .190 | .302 | .450 | .752 |
| May 27, 2018 | @ TB | L 8-3 | 4 | 1 | 0 | 0 | 0 | 0 | .196 | .310 | .464 | .774 |
| May 24, 2018 | @ CHW | W 9-3 | 4 | 1 | 2 | 0 | 2 | 0 | .204 | .315 | .484 | .799 |
| May 23, 2018 | @ CHW | L 11-1 | 0 | 0 | 0 | 0 | 0 | 0 | .191 | .301 | .483 | .784 |
| May 22, 2018 | @ CHW | L 3-2 | 3 | 1 | 0 | 0 | 0 | 0 | .191 | .301 | .483 | .784 |
| May 19, 2018 | @ BOS | L 6-3 | 3 | 1 | 1 | 1 | 2 | 0 | .198 | .303 | .500 | .803 |
| May 16, 2018 | vs PHI | L 4-1 | 3 | 0 | 0 | 0 | 0 | 0 | .193 | .295 | .470 | .765 |
| May 10, 2018 | vs KC | W 11-6 | 2 | 1 | 0 | 0 | 0 | 0 | .200 | .304 | .488 | .792 |
| May 6, 2018 |  @ ATH | L 2-1 | 3 | 1 | 1 | 1 | 1 | 0 | .205 | .311 | .500 | .811 |
| May 5, 2018 | @ ATH | L 2-0 F/12 | 3 | 0 | 0 | 0 | 0 | 0 | .200 | .310 | .467 | .777 |
| May 4, 2018 | @ ATH | L 6-4 | 4 | 0 | 0 | 0 | 0 | 0 | .208 | .313 | .486 | .799 |
| May 3, 2018 |  @ LAA | L 12-3 | 4 | 0 | 0 | 0 | 0 | 0 | .221 | .329 | .515 | .844 |
| May 2, 2018 | @ LAA | L 10-7 | 1 | 0 | 1 | 0 | 0 | 0 | .234 | .347 | .547 | .894 |
| May 1, 2018 | @ LAA | L 3-2 | 4 | 0 | 0 | 0 | 0 | 0 | .222 | .338 | .540 | .878 |
| Apr 29, 2018 |  vs DET | W 5-3 | 4 | 2 | 2 | 2 | 3 | 0 | .237 | .357 | .576 | .933 |
| Apr 28, 2018 | vs DET | L 9-5 | 0 | 1 | 0 | 0 | 0 | 0 | .218 | .348 | .473 | .821 |
| Apr 27, 2018 | vs DET | W 6-0 | 3 | 2 | 2 | 2 | 3 | 0 | .218 | .338 | .473 | .811 |
| Apr 26, 2018 | vs TB | L 9-5 | 5 | 0 | 1 | 0 | 0 | 0 | .192 | .323 | .346 | .669 |
| Apr 25, 2018 | vs TB | L 8-4 | 2 | 1 | 0 | 0 | 0 | 0 | .191 | .333 | .362 | .695 |
| Apr 23, 2018 |  vs CLE | L 2-1 | 3 | 0 | 0 | 0 | 0 | 0 | .200 | .321 | .378 | .699 |
| Apr 22, 2018 | vs CLE | L 7-3 | 3 | 0 | 0 | 0 | 0 | 0 | .214 | .340 | .405 | .745 |
| Apr 21, 2018 | vs CLE | L 4-0 | 4 | 0 | 0 | 0 | 0 | 0 | .231 | .362 | .436 | .798 |
| Apr 20, 2018 | vs CLE | W 3-1 | 4 | 0 | 0 | 0 | 0 | 0 | .257 | .395 | .486 | .881 |
| Apr 19, 2018 | @ DET | L 13-8 | 5 | 1 | 1 | 0 | 0 | 0 | .290 | .436 | .548 | .984 |
| Apr 18, 2018 | @ DET | L 6-5 | 1 | 0 | 0 | 0 | 0 | 0 | .308 | .471 | .615 | 1.086 |
| Apr 17, 2018 | @ DET | L 4-2 | 1 | 0 | 1 | 0 | 0 | 0 | .320 | .485 | .640 | 1.125 |
| Apr 15, 2018 | @ BOS | L 3-1 | 1 | 0 | 0 | 0 | 0 | 0 | .292 | .469 | .625 | 1.094 |
| Apr 14, 2018 | @ BOS | L 10-3 | 3 | 1 | 2 | 1 | 2 | 0 | .304 | .484 | .652 | 1.136 |
| Apr 13, 2018 | @ BOS | L 7-3 | 1 | 0 | 0 | 0 | 0 | 0 | .250 | .444 | .500 | .944 |
| Apr 11, 2018 | vs TOR | W 5-3 | 3 | 1 | 1 | 0 | 0 | 0 | .263 | .462 | .526 | .988 |
| Apr 10, 2018 | vs TOR | L 2-1 | 3 | 0 | 0 | 0 | 0 | 0 | .250 | .455 | .500 | .955 |
| Apr 9, 2018 | vs TOR | L 7-1 | 1 | 0 | 1 | 0 | 0 | 0 | .308 | .500 | .615 | 1.115 |
| Apr 8, 2018 | @ NYY | W 8-7 F/12 | 0 | 1 | 0 | 0 | 0 | 0 | .250 | .471 | .583 | 1.054 |
| Apr 7, 2018 | @ NYY | L 8-3 | 3 | 1 | 1 | 0 | 1 | 0 | .250 | .438 | .583 | 1.021 |
| Apr 6, 2018 | @ NYY | W 7-3 F/14 | 2 | 1 | 2 | 1 | 4 | 0 | .222 | .417 | .556 | .972 |
| Apr 2, 2018 |  @ HOU | L 6-1 | 3 | 0 | 0 | 0 | 0 | 0 | .000 | .222 | .000 | .222 |
| Apr 1, 2018 |  vs MIN | L 7-0 | 3 | 0 | 0 | 0 | 0 | 0 | .000 | .200 | .000 | .200 |
| Mar 29, 2018 | vs MIN | W 3-2 F/11 | 1 | 0 | 0 | 0 | 0 | 0 | .000 | .500 | .000 | .500 |
What the columns mean: AB · R · H · HR · RBI · SB · AVG · OBP · SLG · OPS
Answered about Pedro Alvarez in 2018
Source: ESPN public MLB data, 2018 season.