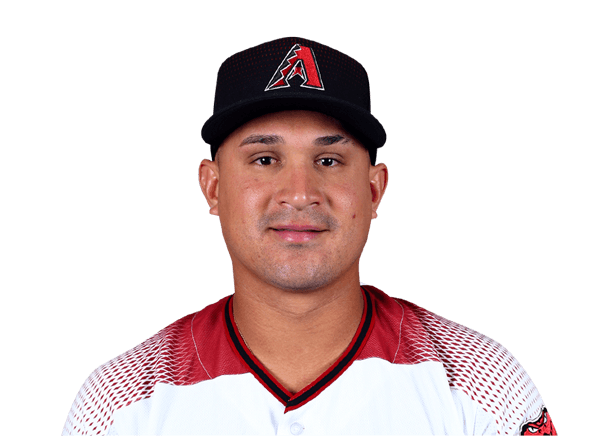
Oswaldo Arcia 2016 season stats
Oswaldo Arcia played 69 games in the 2016 MLB regular season, with a .203 batting average, 8 home runs and 23 RBI.
2016 season stats
2016 regular seasonMIN/TB/MIA/SD
- GP
- 69
- AB
- 202
- R
- 17
- H
- 41
- HR
- 8
- RBI
- 23
- SB
- 1
- AVG
- .203
- OBP
- .270
- SLG
- .366
- OPS
- .637
- 2B
- 7
2016 splits
Totals, from the 69 regular-season games in the log.
By opponent
2016 game log
| AB: At-bats: trips to the plate that ended in a hit, an out or an error. Walks and sacrifices are not counted. | R: Runs — scored by the batter, or allowed by the pitcher. | H: Times the batter reached base by hitting the ball, without help from an error. | HR: Home runs hit. | RBI: Runs that scored because of this batter's plate appearance. | SB: Bases taken while the pitcher was delivering. Being caught is counted separately. | AVG: Hits per at-bat. .300 is the traditional line between a good hitter and a great one. | OBP: Share of plate appearances that ended with the batter on base — hits, walks and hit-by-pitches. | SLG: Total bases per at-bat, so a home run counts four times a single. | OPS: On-base percentage plus slugging. Around .800 is All-Star level, .900 is MVP territory. | |||
|---|---|---|---|---|---|---|---|---|---|---|---|---|
| Sep 18, 2016 |  @ COL | L 6-3 | 1 | 0 | 0 | 0 | 0 | 0 | .111 | .149 | .267 | .416 |
| Sep 17, 2016 | @ COL | L 8-0 | 3 | 0 | 0 | 0 | 0 | 0 | .114 | .152 | .273 | .425 |
| Sep 13, 2016 |  @ SF | W 6-4 | 3 | 0 | 0 | 0 | 0 | 0 | .122 | .163 | .293 | .455 |
| Sep 12, 2016 | @ SF | W 4-0 | 4 | 0 | 0 | 0 | 0 | 0 | .132 | .175 | .316 | .491 |
| Sep 11, 2016 | vs COL | L 3-2 F/10 | 4 | 0 | 0 | 0 | 0 | 0 | .147 | .194 | .353 | .547 |
| Sep 8, 2016 | vs COL | W 14-1 | 1 | 0 | 0 | 0 | 0 | 0 | .167 | .219 | .400 | .619 |
| Sep 6, 2016 |  vs BOS | L 5-1 | 4 | 0 | 1 | 0 | 0 | 0 | .172 | .226 | .414 | .640 |
| Sep 5, 2016 | vs BOS | W 2-1 | 3 | 0 | 0 | 0 | 0 | 0 | .160 | .222 | .440 | .662 |
| Sep 4, 2016 |  @ LAD | L 7-4 | 3 | 0 | 0 | 0 | 0 | 0 | .182 | .250 | .500 | .750 |
| Sep 2, 2016 | @ LAD | W 4-2 | 2 | 0 | 0 | 0 | 0 | 0 | .211 | .250 | .579 | .829 |
| Sep 1, 2016 |  @ ATL | L 9-6 | 4 | 0 | 0 | 0 | 0 | 0 | .235 | .278 | .647 | .925 |
| Aug 31, 2016 | @ ATL | L 8-1 | 3 | 1 | 1 | 1 | 1 | 0 | — | — | — | — |
| Aug 30, 2016 | @ ATL | L 7-3 | 4 | 1 | 2 | 1 | 3 | 0 | .300 | .300 | .700 | 1.000 |
| Aug 27, 2016 |  @ MIA | W 1-0 | 4 | 0 | 1 | 0 | 0 | 0 | .167 | .167 | .167 | .333 |
| Aug 24, 2016 |  vs KC | W 3-0 | 1 | 0 | 0 | 0 | 0 | 0 | .000 | .000 | .000 | .000 |
What the columns mean: AB · R · H · HR · RBI · SB · AVG · OBP · SLG · OPS
All 69 gamesOnly the last 15 games
| AB: At-bats: trips to the plate that ended in a hit, an out or an error. Walks and sacrifices are not counted. | R: Runs — scored by the batter, or allowed by the pitcher. | H: Times the batter reached base by hitting the ball, without help from an error. | HR: Home runs hit. | RBI: Runs that scored because of this batter's plate appearance. | SB: Bases taken while the pitcher was delivering. Being caught is counted separately. | AVG: Hits per at-bat. .300 is the traditional line between a good hitter and a great one. | OBP: Share of plate appearances that ended with the batter on base — hits, walks and hit-by-pitches. | SLG: Total bases per at-bat, so a home run counts four times a single. | OPS: On-base percentage plus slugging. Around .800 is All-Star level, .900 is MVP territory. | |||
|---|---|---|---|---|---|---|---|---|---|---|---|---|
| Sep 18, 2016 | @ COL | L 6-3 | 1 | 0 | 0 | 0 | 0 | 0 | .111 | .149 | .267 | .416 |
| Sep 17, 2016 | @ COL | L 8-0 | 3 | 0 | 0 | 0 | 0 | 0 | .114 | .152 | .273 | .425 |
| Sep 13, 2016 | @ SF | W 6-4 | 3 | 0 | 0 | 0 | 0 | 0 | .122 | .163 | .293 | .455 |
| Sep 12, 2016 | @ SF | W 4-0 | 4 | 0 | 0 | 0 | 0 | 0 | .132 | .175 | .316 | .491 |
| Sep 11, 2016 | vs COL | L 3-2 F/10 | 4 | 0 | 0 | 0 | 0 | 0 | .147 | .194 | .353 | .547 |
| Sep 8, 2016 | vs COL | W 14-1 | 1 | 0 | 0 | 0 | 0 | 0 | .167 | .219 | .400 | .619 |
| Sep 6, 2016 | vs BOS | L 5-1 | 4 | 0 | 1 | 0 | 0 | 0 | .172 | .226 | .414 | .640 |
| Sep 5, 2016 | vs BOS | W 2-1 | 3 | 0 | 0 | 0 | 0 | 0 | .160 | .222 | .440 | .662 |
| Sep 4, 2016 | @ LAD | L 7-4 | 3 | 0 | 0 | 0 | 0 | 0 | .182 | .250 | .500 | .750 |
| Sep 2, 2016 | @ LAD | W 4-2 | 2 | 0 | 0 | 0 | 0 | 0 | .211 | .250 | .579 | .829 |
| Sep 1, 2016 | @ ATL | L 9-6 | 4 | 0 | 0 | 0 | 0 | 0 | .235 | .278 | .647 | .925 |
| Aug 31, 2016 | @ ATL | L 8-1 | 3 | 1 | 1 | 1 | 1 | 0 | — | — | — | — |
| Aug 30, 2016 | @ ATL | L 7-3 | 4 | 1 | 2 | 1 | 3 | 0 | .300 | .300 | .700 | 1.000 |
| Aug 27, 2016 | @ MIA | W 1-0 | 4 | 0 | 1 | 0 | 0 | 0 | .167 | .167 | .167 | .333 |
| Aug 24, 2016 | vs KC | W 3-0 | 1 | 0 | 0 | 0 | 0 | 0 | .000 | .000 | .000 | .000 |
| Aug 23, 2016 | vs KC | L 1-0 | 1 | 0 | 0 | 0 | 0 | 0 | .000 | .000 | .000 | .000 |
| Jul 26, 2016 | @ LAD | L 3-2 | 2 | 0 | 1 | 0 | 0 | 0 | .229 | .303 | .395 | .698 |
| Jul 24, 2016 |  @ ATH | L 3-2 | 3 | 0 | 0 | 0 | 0 | 0 | .226 | .301 | .394 | .694 |
| Jul 23, 2016 | @ ATH | L 4-3 | 3 | 0 | 2 | 0 | 1 | 0 | .230 | .306 | .401 | .707 |
| Jul 20, 2016 | @ COL | W 11-3 | 1 | 0 | 0 | 0 | 0 | 0 | .221 | .299 | .389 | .689 |
| Jul 19, 2016 | @ COL | W 10-1 | 2 | 2 | 1 | 0 | 0 | 0 | .223 | .301 | .392 | .693 |
| Jul 18, 2016 | @ COL | L 7-4 | 1 | 0 | 0 | 0 | 0 | 0 | .219 | .294 | .390 | .685 |
| Jul 17, 2016 |  vs BAL | W 5-2 | 1 | 1 | 1 | 1 | 2 | 0 | .221 | .296 | .393 | .689 |
| Jul 15, 2016 | vs BAL | L 4-3 | 1 | 0 | 0 | 0 | 0 | 0 | .215 | .288 | .368 | .656 |
| Jul 10, 2016 | @ BOS | L 4-0 | 3 | 0 | 0 | 0 | 0 | 0 | .217 | .289 | .371 | .660 |
| Jul 9, 2016 | @ BOS | L 4-1 | 3 | 0 | 0 | 0 | 0 | 0 | .221 | .295 | .379 | .673 |
| Jul 7, 2016 |  vs LAA | L 5-1 | 3 | 0 | 0 | 0 | 0 | 0 | .226 | .301 | .387 | .688 |
| Jul 5, 2016 | vs LAA | L 13-5 | 4 | 0 | 0 | 0 | 0 | 0 | .231 | .302 | .396 | .698 |
| Jul 4, 2016 | vs LAA | W 4-2 | 2 | 0 | 0 | 0 | 0 | 0 | .238 | .310 | .408 | .718 |
| Jul 2, 2016 |  vs DET | L 3-2 | 3 | 0 | 0 | 0 | 0 | 0 | .242 | .310 | .414 | .724 |
| Jul 1, 2016 | vs DET | L 10-2 | 2 | 0 | 0 | 0 | 0 | 0 | .248 | .317 | .424 | .741 |
| Jun 30, 2016 | vs DET | L 10-7 | 4 | 1 | 2 | 0 | 0 | 1 | .252 | .316 | .431 | .747 |
| Jun 28, 2016 | vs BOS | L 8-2 | 4 | 0 | 1 | 0 | 0 | 0 | .244 | .311 | .429 | .739 |
| Jun 27, 2016 | vs BOS | W 13-7 | 5 | 2 | 3 | 0 | 0 | 0 | .243 | .313 | .435 | .747 |
| Jun 26, 2016 | @ BAL | L 12-5 | 4 | 1 | 3 | 1 | 3 | 0 | .227 | .301 | .418 | .719 |
| Jun 25, 2016 | @ BAL | L 8-6 | 2 | 0 | 0 | 0 | 1 | 0 | .208 | .286 | .358 | .644 |
| Jun 25, 2016 | @ BAL | L 5-0 | 1 | 0 | 0 | 0 | 0 | 0 | .212 | .287 | .365 | .652 |
| Jun 14, 2016 | @ LAA | L 5-4 | 4 | 0 | 0 | 0 | 0 | 0 | .214 | .289 | .369 | .658 |
| Jun 11, 2016 | vs BOS | L 15-4 | 1 | 0 | 0 | 0 | 0 | 0 | .222 | .300 | .384 | .684 |
| Jun 9, 2016 | vs MIA | L 10-3 | 2 | 0 | 0 | 0 | 0 | 0 | .224 | .303 | .388 | .691 |
| Jun 8, 2016 | vs MIA | W 7-5 | 4 | 0 | 2 | 0 | 0 | 0 | .229 | .308 | .396 | .704 |
| May 31, 2016 | @ ATH | L 7-4 | 3 | 0 | 0 | 0 | 0 | 0 | .217 | .301 | .370 | .671 |
| May 30, 2016 | @ ATH | L 3-2 | 3 | 0 | 0 | 0 | 0 | 0 | .225 | .310 | .382 | .692 |
| May 24, 2016 | vs KC | L 7-4 | 3 | 2 | 2 | 0 | 0 | 0 | .233 | .313 | .395 | .708 |
| May 22, 2016 |  vs TOR | L 3-1 | 3 | 0 | 1 | 0 | 0 | 0 | .217 | .293 | .373 | .667 |
| May 19, 2016 | vs TOR | L 3-2 F/11 | 4 | 0 | 0 | 0 | 0 | 0 | .213 | .292 | .363 | .655 |
| May 16, 2016 | @ DET | L 10-8 | 1 | 0 | 0 | 0 | 0 | 0 | .224 | .306 | .382 | .687 |
| May 15, 2016 |  @ CLE | W 5-1 | 4 | 0 | 0 | 0 | 0 | 0 | .227 | .310 | .387 | .696 |
| May 13, 2016 | @ CLE | L 7-6 | 4 | 0 | 0 | 0 | 0 | 0 | .239 | .325 | .408 | .733 |
| May 10, 2016 | vs BAL | L 5-3 | 4 | 0 | 0 | 0 | 0 | 0 | .254 | .342 | .433 | .775 |
| May 8, 2016 |  @ CHW | L 3-1 | 4 | 0 | 1 | 0 | 0 | 0 | .270 | .361 | .460 | .821 |
| May 7, 2016 | @ CHW | L 7-2 | 2 | 0 | 0 | 0 | 1 | 0 | .271 | .368 | .475 | .842 |
| May 6, 2016 | @ CHW | L 10-4 | 2 | 1 | 1 | 1 | 2 | 0 | .281 | .359 | .491 | .851 |
| May 4, 2016 |  @ HOU | L 16-4 | 3 | 1 | 2 | 0 | 0 | 0 | .273 | .333 | .436 | .770 |
| May 3, 2016 | @ HOU | L 6-4 | 1 | 0 | 0 | 0 | 0 | 0 | .250 | .304 | .423 | .727 |
| May 1, 2016 | vs DET | L 6-5 | 4 | 0 | 2 | 0 | 2 | 0 | .255 | .309 | .431 | .740 |
| Apr 29, 2016 | vs DET | L 9-2 | 4 | 1 | 1 | 0 | 0 | 0 | .234 | .294 | .426 | .720 |
| Apr 27, 2016 | vs CLE | L 6-5 | 4 | 0 | 1 | 0 | 1 | 0 | .233 | .298 | .442 | .740 |
| Apr 26, 2016 | vs CLE | W 6-5 | 4 | 0 | 0 | 0 | 0 | 0 | .231 | .302 | .462 | .764 |
| Apr 25, 2016 | vs CLE | W 4-3 | 4 | 1 | 1 | 1 | 1 | 0 | .257 | .333 | .514 | .848 |
| Apr 23, 2016 |  @ WSH | L 2-0 | 3 | 0 | 0 | 0 | 0 | 0 | .258 | .343 | .452 | .794 |
| Apr 20, 2016 |  @ MIL | L 10-5 | 4 | 1 | 1 | 1 | 2 | 0 | .286 | .355 | .500 | .855 |
| Apr 19, 2016 | vs MIL | L 6-5 | 3 | 0 | 0 | 0 | 0 | 0 | .292 | .370 | .417 | .787 |
| Apr 18, 2016 | vs MIL | W 7-4 F/6 | 4 | 0 | 2 | 0 | 0 | 0 | .333 | .391 | .476 | .867 |
| Apr 17, 2016 | vs LAA | W 3-2 F/12 | 5 | 0 | 3 | 0 | 1 | 0 | .294 | .368 | .471 | .839 |
| Apr 16, 2016 | vs LAA | W 6-4 | 4 | 1 | 2 | 1 | 2 | 0 | — | — | — | — |
| Apr 15, 2016 | vs LAA | W 5-4 | 4 | 0 | 0 | 0 | 0 | 0 | .000 | .111 | .000 | .111 |
| Apr 13, 2016 | vs CHW | L 3-0 | 1 | 0 | 0 | 0 | 0 | 0 | .000 | .200 | .000 | .200 |
| Apr 9, 2016 | @ KC | L 7-0 | 3 | 0 | 0 | 0 | 0 | 0 | .000 | .250 | .000 | .250 |
What the columns mean: AB · R · H · HR · RBI · SB · AVG · OBP · SLG · OPS
Answered about Oswaldo Arcia in 2016
Source: ESPN public MLB data, 2016 season.