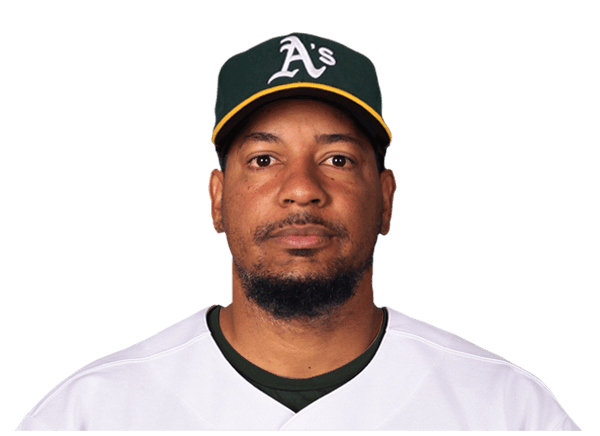
Manny Ramirez 2006 season stats
Red Sox
Manny Ramirez played 130 games for the Boston Red Sox in the 2006 MLB regular season, with a .321 batting average, 35 home runs and 102 RBI.
2006 season stats
2006 regular season Red Sox
- GP
- 130
- AB
- 449
- R
- 79
- H
- 144
- HR
- 35
- RBI
- 102
- SB
- 0
- AVG
- .321
- OBP
- .439
- SLG
- .619
- OPS
- 1.058
- 2B
- 27
Against other left fielders
2006 regular season, 81 MLB left fielders with 25+ games.
- Home Runs35
Higher than 96% of the other 80 MLB left fielders.
- Batting Average.321
Higher than 99% of the other 80 MLB left fielders.
- RBI102
Higher than 94% of the other 80 MLB left fielders.
2006 splits
Totals, from the 130 regular-season games in the log.
By opponent
2006 game log
| AB: At-bats: trips to the plate that ended in a hit, an out or an error. Walks and sacrifices are not counted. | R: Runs — scored by the batter, or allowed by the pitcher. | H: Times the batter reached base by hitting the ball, without help from an error. | HR: Home runs hit. | RBI: Runs that scored because of this batter's plate appearance. | SB: Bases taken while the pitcher was delivering. Being caught is counted separately. | AVG: Hits per at-bat. .300 is the traditional line between a good hitter and a great one. | OBP: Share of plate appearances that ended with the batter on base — hits, walks and hit-by-pitches. | SLG: Total bases per at-bat, so a home run counts four times a single. | OPS: On-base percentage plus slugging. Around .800 is All-Star level, .900 is MVP territory. | |||
|---|---|---|---|---|---|---|---|---|---|---|---|---|
| Sep 30, 2006 |  vs BAL | L 5-4 | 3 | 1 | 2 | 1 | 1 | 0 | .320 | .437 | .613 | 1.050 |
| Sep 23, 2006 |  @ TOR | L 5-3 | 0 | 0 | 0 | 0 | 0 | 0 | .318 | .435 | .606 | 1.040 |
| Sep 9, 2006 |  vs KC | L 10-4 F/12 | 4 | 0 | 0 | 0 | 0 | 0 | .318 | .434 | .606 | 1.039 |
| Sep 8, 2006 | vs KC | L 10-9 | 5 | 0 | 1 | 0 | 1 | 0 | .320 | .436 | .611 | 1.047 |
| Sep 6, 2006 |  vs CHW | L 8-1 | 2 | 0 | 0 | 0 | 0 | 0 | .322 | .438 | .616 | 1.054 |
| Sep 5, 2006 | vs CHW | W 1-0 | 3 | 0 | 0 | 0 | 0 | 0 | .323 | .439 | .619 | 1.058 |
| Sep 4, 2006 | vs CHW | W 3-2 F/10 | 2 | 1 | 1 | 0 | 0 | 0 | .326 | .442 | .623 | 1.065 |
| Aug 26, 2006 |  @ SEA | L 4-3 | 3 | 0 | 0 | 0 | 0 | 0 | .325 | .440 | .621 | 1.061 |
| Aug 23, 2006 |  @ LAA | W 5-4 | 2 | 0 | 0 | 0 | 0 | 0 | .327 | .441 | .626 | 1.067 |
| Aug 22, 2006 | @ LAA | L 4-3 | 1 | 0 | 0 | 0 | 0 | 0 | .329 | .443 | .629 | 1.072 |
| Aug 21, 2006 |  vs NYY | L 2-1 | 0 | 0 | 0 | 0 | 0 | 0 | .329 | .444 | .630 | 1.074 |
| Aug 20, 2006 | vs NYY | L 8-5 F/10 | 2 | 0 | 2 | 0 | 1 | 0 | .329 | .441 | .630 | 1.072 |
| Aug 19, 2006 | vs NYY | L 13-5 | 1 | 1 | 1 | 1 | 3 | 0 | .326 | .436 | .626 | 1.062 |
| Aug 18, 2006 | vs NYY | L 12-4 | 2 | 1 | 1 | 1 | 1 | 0 | .320 | .430 | .615 | 1.045 |
| Aug 18, 2006 | vs NYY | L 14-11 | 6 | 1 | 4 | 0 | 2 | 0 | .325 | .433 | .618 | 1.051 |
What the columns mean: AB · R · H · HR · RBI · SB · AVG · OBP · SLG · OPS
All 130 gamesOnly the last 15 games
| AB: At-bats: trips to the plate that ended in a hit, an out or an error. Walks and sacrifices are not counted. | R: Runs — scored by the batter, or allowed by the pitcher. | H: Times the batter reached base by hitting the ball, without help from an error. | HR: Home runs hit. | RBI: Runs that scored because of this batter's plate appearance. | SB: Bases taken while the pitcher was delivering. Being caught is counted separately. | AVG: Hits per at-bat. .300 is the traditional line between a good hitter and a great one. | OBP: Share of plate appearances that ended with the batter on base — hits, walks and hit-by-pitches. | SLG: Total bases per at-bat, so a home run counts four times a single. | OPS: On-base percentage plus slugging. Around .800 is All-Star level, .900 is MVP territory. | |||
|---|---|---|---|---|---|---|---|---|---|---|---|---|
| Sep 30, 2006 | vs BAL | L 5-4 | 3 | 1 | 2 | 1 | 1 | 0 | .320 | .437 | .613 | 1.050 |
| Sep 23, 2006 | @ TOR | L 5-3 | 0 | 0 | 0 | 0 | 0 | 0 | .318 | .435 | .606 | 1.040 |
| Sep 9, 2006 | vs KC | L 10-4 F/12 | 4 | 0 | 0 | 0 | 0 | 0 | .318 | .434 | .606 | 1.039 |
| Sep 8, 2006 | vs KC | L 10-9 | 5 | 0 | 1 | 0 | 1 | 0 | .320 | .436 | .611 | 1.047 |
| Sep 6, 2006 | vs CHW | L 8-1 | 2 | 0 | 0 | 0 | 0 | 0 | .322 | .438 | .616 | 1.054 |
| Sep 5, 2006 | vs CHW | W 1-0 | 3 | 0 | 0 | 0 | 0 | 0 | .323 | .439 | .619 | 1.058 |
| Sep 4, 2006 | vs CHW | W 3-2 F/10 | 2 | 1 | 1 | 0 | 0 | 0 | .326 | .442 | .623 | 1.065 |
| Aug 26, 2006 | @ SEA | L 4-3 | 3 | 0 | 0 | 0 | 0 | 0 | .325 | .440 | .621 | 1.061 |
| Aug 23, 2006 | @ LAA | W 5-4 | 2 | 0 | 0 | 0 | 0 | 0 | .327 | .441 | .626 | 1.067 |
| Aug 22, 2006 | @ LAA | L 4-3 | 1 | 0 | 0 | 0 | 0 | 0 | .329 | .443 | .629 | 1.072 |
| Aug 21, 2006 | vs NYY | L 2-1 | 0 | 0 | 0 | 0 | 0 | 0 | .329 | .444 | .630 | 1.074 |
| Aug 20, 2006 | vs NYY | L 8-5 F/10 | 2 | 0 | 2 | 0 | 1 | 0 | .329 | .441 | .630 | 1.072 |
| Aug 19, 2006 | vs NYY | L 13-5 | 1 | 1 | 1 | 1 | 3 | 0 | .326 | .436 | .626 | 1.062 |
| Aug 18, 2006 | vs NYY | L 12-4 | 2 | 1 | 1 | 1 | 1 | 0 | .320 | .430 | .615 | 1.045 |
| Aug 18, 2006 | vs NYY | L 14-11 | 6 | 1 | 4 | 0 | 2 | 0 | .325 | .433 | .618 | 1.051 |
| Aug 16, 2006 |  vs DET | W 6-4 | 4 | 0 | 1 | 0 | 0 | 0 | .319 | .427 | .608 | 1.036 |
| Aug 15, 2006 | vs DET | L 3-2 | 4 | 0 | 0 | 0 | 0 | 0 | .319 | .429 | .612 | 1.041 |
| Aug 14, 2006 | vs DET | L 7-4 | 2 | 1 | 1 | 0 | 0 | 0 | .323 | .432 | .618 | 1.050 |
| Aug 13, 2006 | vs BAL | W 11-9 | 3 | 1 | 0 | 0 | 0 | 0 | .322 | .430 | .618 | 1.048 |
| Aug 12, 2006 | vs BAL | W 8-7 F/10 | 4 | 1 | 1 | 0 | 0 | 0 | .324 | .431 | .623 | 1.054 |
| Aug 11, 2006 | vs BAL | W 9-2 | 4 | 0 | 2 | 0 | 2 | 0 | .325 | .432 | .627 | 1.058 |
| Aug 10, 2006 | @ KC | L 5-4 | 4 | 0 | 2 | 0 | 0 | 0 | .323 | .431 | .628 | 1.059 |
| Aug 9, 2006 | @ KC | L 5-4 | 3 | 1 | 2 | 1 | 2 | 0 | .321 | .430 | .630 | 1.060 |
| Aug 8, 2006 | @ KC | L 6-4 | 4 | 1 | 2 | 0 | 0 | 0 | .319 | .426 | .621 | 1.048 |
| Aug 6, 2006 |  @ TB | L 7-6 F/10 | 5 | 1 | 1 | 0 | 0 | 0 | .317 | .425 | .620 | 1.045 |
| Aug 5, 2006 | @ TB | L 8-5 | 4 | 1 | 2 | 1 | 3 | 0 | .318 | .426 | .626 | 1.051 |
| Aug 4, 2006 | @ TB | W 3-2 | 3 | 0 | 1 | 0 | 0 | 0 | .316 | .426 | .619 | 1.045 |
| Aug 3, 2006 |  vs CLE | L 7-6 | 5 | 0 | 2 | 0 | 1 | 0 | .316 | .425 | .621 | 1.047 |
| Aug 2, 2006 | vs CLE | W 6-5 | 4 | 1 | 1 | 1 | 1 | 0 | .315 | .426 | .624 | 1.050 |
| Aug 1, 2006 | vs CLE | L 6-3 | 4 | 0 | 2 | 0 | 0 | 0 | .316 | .427 | .620 | 1.047 |
| Jul 31, 2006 | vs CLE | W 9-8 | 3 | 1 | 1 | 1 | 2 | 0 | .314 | .427 | .619 | 1.045 |
| Jul 30, 2006 | vs LAA | L 10-4 | 4 | 0 | 1 | 0 | 1 | 0 | .313 | .426 | .613 | 1.038 |
| Jul 29, 2006 | vs LAA | W 7-6 F/11 | 3 | 1 | 1 | 0 | 1 | 0 | .314 | .428 | .614 | 1.041 |
| Jul 28, 2006 | vs LAA | L 8-3 | 3 | 0 | 1 | 0 | 1 | 0 | .314 | .428 | .616 | 1.044 |
| Jul 26, 2006 |  @ ATH | L 5-1 | 4 | 1 | 1 | 0 | 0 | 0 | .314 | .427 | .616 | 1.043 |
| Jul 25, 2006 | @ ATH | W 13-5 | 3 | 2 | 2 | 1 | 3 | 0 | .315 | .429 | .617 | 1.046 |
| Jul 24, 2006 | @ ATH | W 7-3 | 4 | 1 | 2 | 1 | 3 | 0 | .311 | .427 | .608 | 1.035 |
| Jul 23, 2006 | @ SEA | L 9-8 | 4 | 0 | 1 | 0 | 2 | 0 | .309 | .426 | .600 | 1.026 |
| Jul 22, 2006 | @ SEA | L 5-2 | 4 | 0 | 1 | 0 | 0 | 0 | .310 | .429 | .604 | 1.033 |
| Jul 21, 2006 | @ SEA | W 9-4 | 4 | 2 | 2 | 1 | 2 | 0 | .311 | .431 | .609 | 1.039 |
| Jul 20, 2006 |  vs TEX | W 6-4 | 3 | 2 | 2 | 0 | 1 | 0 | .308 | .429 | .601 | 1.029 |
| Jul 19, 2006 | vs KC | W 1-0 | 3 | 1 | 1 | 1 | 1 | 0 | .305 | .425 | .597 | 1.022 |
| Jul 18, 2006 | vs KC | W 1-0 | 4 | 0 | 1 | 0 | 0 | 0 | .304 | .426 | .590 | 1.016 |
| Jul 17, 2006 | vs KC | W 5-4 | 3 | 1 | 1 | 0 | 1 | 0 | .305 | .428 | .591 | 1.019 |
| Jul 16, 2006 | vs ATH | L 8-1 | 2 | 0 | 1 | 0 | 0 | 0 | .305 | .430 | .593 | 1.023 |
| Jul 15, 2006 | vs ATH | W 7-0 | 5 | 2 | 3 | 0 | 1 | 0 | .304 | .426 | .594 | 1.020 |
| Jul 14, 2006 | vs ATH | L 15-3 | 3 | 0 | 0 | 0 | 0 | 0 | .299 | .424 | .591 | 1.015 |
| Jul 13, 2006 | vs ATH | L 5-4 F/11 | 6 | 0 | 1 | 0 | 0 | 0 | .302 | .426 | .597 | 1.022 |
| Jul 9, 2006 | @ CHW | L 6-5 F/19 | 8 | 0 | 1 | 0 | 0 | 0 | .304 | .430 | .606 | 1.036 |
| Jul 8, 2006 | @ CHW | W 9-6 | 4 | 1 | 3 | 0 | 0 | 0 | .310 | .436 | .616 | 1.051 |
| Jul 7, 2006 | @ CHW | W 7-2 | 5 | 0 | 0 | 0 | 0 | 0 | .303 | .430 | .606 | 1.037 |
| Jul 6, 2006 | @ TB | W 12-5 | 4 | 1 | 2 | 1 | 2 | 0 | .309 | .437 | .618 | 1.054 |
| Jul 5, 2006 | @ TB | L 5-2 | 4 | 0 | 0 | 0 | 0 | 0 | .306 | .434 | .608 | 1.042 |
| Jul 4, 2006 | @ TB | L 9-6 | 3 | 1 | 2 | 1 | 3 | 0 | .311 | .439 | .617 | 1.057 |
| Jul 3, 2006 | @ TB | L 3-0 | 4 | 0 | 1 | 0 | 0 | 0 | .307 | .434 | .605 | 1.039 |
| Jul 2, 2006 |  @ MIA | W 4-3 | 3 | 0 | 1 | 0 | 0 | 0 | .307 | .436 | .607 | 1.043 |
| Jul 1, 2006 | @ MIA | W 11-5 | 4 | 2 | 2 | 2 | 5 | 0 | .307 | .435 | .610 | 1.046 |
| Jun 30, 2006 | @ MIA | L 5-2 | 4 | 0 | 3 | 0 | 2 | 0 | .304 | .435 | .588 | 1.023 |
| Jun 29, 2006 |  vs NYM | W 4-2 | 3 | 0 | 0 | 0 | 0 | 0 | .297 | .430 | .585 | 1.016 |
| Jun 28, 2006 | vs NYM | W 10-2 | 3 | 2 | 1 | 0 | 0 | 0 | .300 | .433 | .593 | 1.025 |
| Jun 27, 2006 | vs NYM | W 9-4 | 4 | 1 | 2 | 0 | 2 | 0 | .300 | .432 | .592 | 1.024 |
| Jun 26, 2006 |  vs PHI | W 8-7 F/12 | 4 | 1 | 2 | 0 | 0 | 0 | .297 | .429 | .589 | 1.018 |
| Jun 24, 2006 | vs PHI | W 5-3 F/10 | 1 | 0 | 0 | 0 | 1 | 0 | .293 | .424 | .586 | 1.010 |
| Jun 23, 2006 | vs PHI | W 10-2 | 4 | 2 | 3 | 2 | 5 | 0 | .294 | .423 | .589 | 1.012 |
| Jun 21, 2006 |  vs WSH | W 9-3 | 3 | 1 | 1 | 0 | 1 | 0 | .286 | .418 | .555 | .974 |
| Jun 20, 2006 | vs WSH | W 11-3 | 4 | 0 | 2 | 0 | 1 | 0 | .286 | .417 | .558 | .975 |
| Jun 19, 2006 | vs WSH | W 6-3 | 5 | 2 | 2 | 1 | 1 | 0 | .282 | .416 | .555 | .971 |
| Jun 18, 2006 |  @ ATL | W 10-7 | 4 | 1 | 1 | 1 | 1 | 0 | .279 | .416 | .540 | .956 |
| Jun 16, 2006 | @ ATL | W 4-1 | 3 | 1 | 0 | 0 | 0 | 0 | .280 | .417 | .531 | .947 |
| Jun 15, 2006 |  @ MIN | L 5-3 | 5 | 0 | 0 | 0 | 0 | 0 | .284 | .419 | .538 | .958 |
| Jun 14, 2006 | @ MIN | L 8-1 | 1 | 0 | 0 | 0 | 0 | 0 | .291 | .427 | .552 | .979 |
| Jun 13, 2006 | @ MIN | L 5-2 F/12 | 5 | 0 | 0 | 0 | 0 | 0 | .292 | .422 | .554 | .977 |
| Jun 11, 2006 | vs TEX | W 5-4 | 4 | 1 | 1 | 1 | 1 | 0 | .299 | .431 | .569 | .999 |
| Jun 10, 2006 | vs TEX | L 7-4 | 2 | 1 | 1 | 1 | 2 | 0 | .500 | .750 | 2.000 | 2.750 |
| Jun 9, 2006 | vs TEX | W 4-3 | 3 | 1 | 0 | 0 | 0 | 0 | .301 | .434 | .560 | .993 |
| Jun 8, 2006 | @ NYY | W 9-3 | 3 | 2 | 2 | 0 | 1 | 0 | .305 | .437 | .568 | 1.005 |
| Jun 6, 2006 | @ NYY | L 2-1 | 3 | 0 | 2 | 0 | 0 | 0 | .299 | .429 | .567 | .996 |
| Jun 5, 2006 | @ NYY | L 13-5 | 2 | 0 | 0 | 0 | 0 | 0 | .293 | .424 | .565 | .989 |
| Jun 4, 2006 | @ DET | W 8-3 | 4 | 1 | 1 | 1 | 2 | 0 | .297 | .427 | .571 | .999 |
| Jun 3, 2006 | @ DET | L 6-2 | 3 | 0 | 0 | 0 | 0 | 0 | .298 | .428 | .562 | .990 |
| Jun 2, 2006 | @ DET | W 3-2 | 4 | 0 | 1 | 0 | 1 | 0 | .303 | .431 | .571 | 1.003 |
| May 31, 2006 | @ TOR | W 8-6 | 4 | 2 | 1 | 1 | 2 | 0 | .304 | .435 | .579 | 1.014 |
| May 30, 2006 | @ TOR | L 8-5 | 2 | 0 | 0 | 0 | 1 | 0 | .305 | .435 | .569 | 1.004 |
| May 29, 2006 | @ TOR | L 7-6 | 4 | 1 | 1 | 1 | 2 | 0 | .309 | .431 | .576 | 1.007 |
| May 26, 2006 | vs TB | W 8-4 | 5 | 0 | 1 | 0 | 0 | 0 | .311 | .435 | .565 | 1.000 |
| May 25, 2006 | vs TB | W 4-1 | 4 | 0 | 1 | 0 | 0 | 0 | .314 | .441 | .577 | 1.018 |
| May 24, 2006 | vs NYY | L 8-6 | 4 | 3 | 3 | 2 | 3 | 0 | .316 | .442 | .579 | 1.021 |
| May 23, 2006 | vs NYY | L 7-5 | 5 | 1 | 3 | 1 | 4 | 0 | .304 | .432 | .527 | .959 |
| May 22, 2006 | vs NYY | W 9-5 | 3 | 1 | 2 | 1 | 3 | 0 | .294 | .428 | .503 | .931 |
| May 21, 2006 | @ PHI | L 10-5 | 3 | 0 | 0 | 0 | 0 | 0 | .286 | .426 | .479 | .905 |
| May 20, 2006 | @ PHI | W 8-4 | 4 | 0 | 0 | 0 | 0 | 0 | .292 | .434 | .489 | .923 |
| May 19, 2006 | @ PHI | W 5-3 | 4 | 1 | 1 | 0 | 0 | 0 | .301 | .440 | .504 | .944 |
| May 17, 2006 | @ BAL | L 4-3 | 4 | 0 | 1 | 0 | 0 | 0 | .302 | .445 | .512 | .957 |
| May 16, 2006 | @ BAL | W 6-5 | 3 | 1 | 1 | 1 | 1 | 0 | .304 | .450 | .512 | .962 |
| May 15, 2006 | @ BAL | W 11-1 | 4 | 0 | 1 | 0 | 0 | 0 | .303 | .445 | .492 | .937 |
| May 12, 2006 | vs TEX | L 6-0 F/6 | 2 | 0 | 0 | 0 | 0 | 0 | .305 | .447 | .500 | .947 |
| May 11, 2006 | @ NYY | W 5-3 | 3 | 0 | 0 | 0 | 0 | 0 | .310 | .453 | .509 | .961 |
| May 10, 2006 | @ NYY | L 7-3 | 4 | 0 | 1 | 0 | 0 | 0 | .319 | .455 | .522 | .977 |
| May 9, 2006 | @ NYY | W 14-3 | 4 | 1 | 2 | 1 | 2 | 0 | .321 | .460 | .523 | .983 |
| May 7, 2006 | vs BAL | W 10-3 | 2 | 2 | 2 | 0 | 0 | 0 | .314 | .459 | .495 | .954 |
| May 6, 2006 | vs BAL | W 9-3 | 2 | 2 | 1 | 1 | 2 | 0 | .301 | .443 | .485 | .928 |
| May 5, 2006 | vs BAL | W 6-3 | 4 | 0 | 1 | 0 | 0 | 0 | .297 | .437 | .455 | .892 |
| May 4, 2006 | vs TOR | W 7-4 | 3 | 0 | 0 | 0 | 0 | 0 | .299 | .443 | .464 | .907 |
| May 3, 2006 | vs TOR | L 7-6 | 4 | 2 | 3 | 0 | 0 | 0 | .309 | .449 | .479 | .928 |
| May 1, 2006 | vs NYY | W 7-3 | 3 | 0 | 2 | 0 | 1 | 0 | .289 | .434 | .456 | .889 |
| Apr 30, 2006 | @ TB | L 5-4 | 4 | 0 | 0 | 0 | 0 | 0 | .276 | .417 | .448 | .865 |
| Apr 29, 2006 | @ TB | W 9-6 | 5 | 2 | 2 | 1 | 1 | 0 | .289 | .433 | .470 | .903 |
| Apr 28, 2006 | @ TB | L 5-2 | 1 | 0 | 0 | 0 | 0 | 0 | .282 | .434 | .410 | .845 |
| Apr 27, 2006 | @ CLE | L 15-3 | 4 | 0 | 0 | 0 | 0 | 0 | .286 | .415 | .416 | .830 |
| Apr 26, 2006 | @ CLE | L 7-1 | 3 | 0 | 1 | 0 | 0 | 0 | .301 | .433 | .438 | .872 |
| Apr 25, 2006 | @ CLE | W 8-6 | 4 | 2 | 3 | 1 | 3 | 0 | .300 | .430 | .443 | .873 |
| Apr 23, 2006 | @ TOR | W 6-3 | 3 | 1 | 1 | 0 | 0 | 0 | .273 | .407 | .379 | .786 |
| Apr 22, 2006 | @ TOR | L 8-1 | 3 | 1 | 1 | 0 | 0 | 0 | .270 | .395 | .381 | .776 |
| Apr 21, 2006 | @ TOR | L 7-6 F/12 | 6 | 2 | 2 | 2 | 3 | 0 | .267 | .397 | .383 | .781 |
| Apr 20, 2006 | vs TB | L 5-1 | 3 | 0 | 1 | 0 | 0 | 0 | .259 | .403 | .278 | .681 |
| Apr 19, 2006 | vs TB | W 9-1 | 1 | 1 | 0 | 0 | 0 | 0 | .255 | .397 | .275 | .671 |
| Apr 18, 2006 | vs TB | W 7-4 | 4 | 0 | 2 | 0 | 3 | 0 | .260 | .373 | .280 | .653 |
| Apr 17, 2006 | vs SEA | W 7-6 | 4 | 0 | 2 | 0 | 0 | 0 | .239 | .364 | .239 | .603 |
| Apr 16, 2006 | vs SEA | W 3-2 | 3 | 0 | 1 | 0 | 1 | 0 | .214 | .353 | .214 | .567 |
| Apr 15, 2006 | vs SEA | L 3-0 | 4 | 0 | 1 | 0 | 0 | 0 | .205 | .340 | .205 | .546 |
| Apr 14, 2006 | vs SEA | W 2-1 | 3 | 0 | 0 | 0 | 0 | 0 | .200 | .349 | .200 | .549 |
| Apr 13, 2006 | vs TOR | L 8-6 | 4 | 0 | 1 | 0 | 0 | 0 | .219 | .359 | .219 | .578 |
| Apr 12, 2006 | vs TOR | L 8-4 | 3 | 0 | 0 | 0 | 0 | 0 | .214 | .371 | .214 | .586 |
| Apr 11, 2006 | vs TOR | W 5-3 | 4 | 0 | 0 | 0 | 0 | 0 | .240 | .387 | .240 | .627 |
| Apr 9, 2006 | @ BAL | W 4-1 | 3 | 0 | 0 | 0 | 0 | 0 | .286 | .444 | .286 | .730 |
| Apr 8, 2006 | @ BAL | W 2-1 | 4 | 0 | 2 | 0 | 0 | 0 | .333 | .455 | .333 | .788 |
| Apr 7, 2006 | @ BAL | W 14-8 | 4 | 3 | 3 | 0 | 2 | 0 | .286 | .444 | .286 | .730 |
| Apr 5, 2006 | @ TEX | W 2-1 | 2 | 1 | 0 | 0 | 0 | 0 | .100 | .308 | .100 | .408 |
| Apr 4, 2006 | @ TEX | L 10-4 | 4 | 0 | 0 | 0 | 0 | 0 | .125 | .222 | .125 | .347 |
| Apr 3, 2006 | @ TEX | W 7-3 | 4 | 0 | 1 | 0 | 0 | 0 | .250 | .400 | .250 | .650 |
What the columns mean: AB · R · H · HR · RBI · SB · AVG · OBP · SLG · OPS
Answered about Manny Ramirez in 2006
Source: ESPN public MLB data, 2006 season.