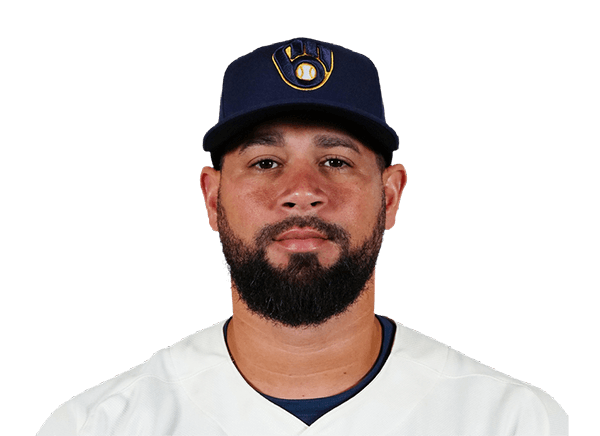
Gary Sanchez 2016 season stats
YankeesCatcher · #99
Compare with…
Gary Sanchez played 53 games for the New York Yankees in the 2016 MLB regular season, with a .299 batting average, 20 home runs and 42 RBI.
2016 season stats
2016 regular season Yankees
- GP
- 53
- AB
- 201
- R
- 34
- H
- 60
- HR
- 20
- RBI
- 42
- SB
- 1
- AVG
- .299
- OBP
- .376
- SLG
- .657
- OPS
- 1.032
- 2B
- 12
2016 splits
Totals, from the 53 regular-season games in the log.
By opponent
2016 game log
| AB: At-bats: trips to the plate that ended in a hit, an out or an error. Walks and sacrifices are not counted. | R: Runs — scored by the batter, or allowed by the pitcher. | H: Times the batter reached base by hitting the ball, without help from an error. | HR: Home runs hit. | RBI: Runs that scored because of this batter's plate appearance. | SB: Bases taken while the pitcher was delivering. Being caught is counted separately. | AVG: Hits per at-bat. .300 is the traditional line between a good hitter and a great one. | OBP: Share of plate appearances that ended with the batter on base — hits, walks and hit-by-pitches. | SLG: Total bases per at-bat, so a home run counts four times a single. | OPS: On-base percentage plus slugging. Around .800 is All-Star level, .900 is MVP territory. | |||
|---|---|---|---|---|---|---|---|---|---|---|---|---|
| Oct 2, 2016 |  vs BAL | L 5-2 | 3 | 1 | 1 | 0 | 0 | 0 | .299 | .376 | .657 | 1.032 |
| Sep 30, 2016 | vs BAL | L 8-1 | 3 | 1 | 0 | 0 | 0 | 0 | .298 | .373 | .662 | 1.035 |
| Sep 29, 2016 |  vs BOS | W 5-1 | 5 | 0 | 0 | 0 | 0 | 0 | .303 | .378 | .672 | 1.050 |
| Sep 28, 2016 | vs BOS | W 5-3 | 3 | 0 | 0 | 0 | 0 | 0 | .311 | .387 | .689 | 1.077 |
| Sep 27, 2016 | vs BOS | W 6-4 | 3 | 1 | 1 | 1 | 2 | 0 | .316 | .390 | .701 | 1.090 |
| Sep 26, 2016 |  @ TOR | W 7-5 | 4 | 0 | 0 | 0 | 2 | 0 | .315 | .388 | .690 | 1.078 |
| Sep 25, 2016 | @ TOR | L 4-3 | 4 | 0 | 0 | 0 | 0 | 0 | .322 | .397 | .706 | 1.103 |
| Sep 24, 2016 | @ TOR | L 3-0 | 4 | 0 | 0 | 0 | 0 | 0 | .330 | .405 | .722 | 1.127 |
| Sep 23, 2016 | @ TOR | L 9-0 | 4 | 0 | 2 | 0 | 0 | 0 | .337 | .413 | .738 | 1.152 |
| Sep 22, 2016 |  @ TB | L 2-0 | 2 | 0 | 0 | 0 | 0 | 0 | .333 | .411 | .738 | 1.150 |
| Sep 21, 2016 | @ TB | W 11-5 | 4 | 3 | 3 | 2 | 5 | 0 | .337 | .410 | .747 | 1.157 |
| Sep 20, 2016 | @ TB | W 5-3 | 3 | 1 | 1 | 1 | 3 | 0 | .327 | .399 | .710 | 1.109 |
| Sep 18, 2016 | @ BOS | L 5-4 | 5 | 1 | 3 | 1 | 1 | 0 | .327 | .393 | .698 | 1.091 |
| Sep 17, 2016 | @ BOS | L 6-5 | 4 | 1 | 1 | 1 | 2 | 0 | .318 | .387 | .682 | 1.069 |
| Sep 16, 2016 | @ BOS | L 7-4 | 5 | 0 | 1 | 0 | 2 | 0 | .320 | .391 | .673 | 1.064 |
What the columns mean: AB · R · H · HR · RBI · SB · AVG · OBP · SLG · OPS
All 53 gamesOnly the last 15 games
| AB: At-bats: trips to the plate that ended in a hit, an out or an error. Walks and sacrifices are not counted. | R: Runs — scored by the batter, or allowed by the pitcher. | H: Times the batter reached base by hitting the ball, without help from an error. | HR: Home runs hit. | RBI: Runs that scored because of this batter's plate appearance. | SB: Bases taken while the pitcher was delivering. Being caught is counted separately. | AVG: Hits per at-bat. .300 is the traditional line between a good hitter and a great one. | OBP: Share of plate appearances that ended with the batter on base — hits, walks and hit-by-pitches. | SLG: Total bases per at-bat, so a home run counts four times a single. | OPS: On-base percentage plus slugging. Around .800 is All-Star level, .900 is MVP territory. | |||
|---|---|---|---|---|---|---|---|---|---|---|---|---|
| Oct 2, 2016 | vs BAL | L 5-2 | 3 | 1 | 1 | 0 | 0 | 0 | .299 | .376 | .657 | 1.032 |
| Sep 30, 2016 | vs BAL | L 8-1 | 3 | 1 | 0 | 0 | 0 | 0 | .298 | .373 | .662 | 1.035 |
| Sep 29, 2016 | vs BOS | W 5-1 | 5 | 0 | 0 | 0 | 0 | 0 | .303 | .378 | .672 | 1.050 |
| Sep 28, 2016 | vs BOS | W 5-3 | 3 | 0 | 0 | 0 | 0 | 0 | .311 | .387 | .689 | 1.077 |
| Sep 27, 2016 | vs BOS | W 6-4 | 3 | 1 | 1 | 1 | 2 | 0 | .316 | .390 | .701 | 1.090 |
| Sep 26, 2016 | @ TOR | W 7-5 | 4 | 0 | 0 | 0 | 2 | 0 | .315 | .388 | .690 | 1.078 |
| Sep 25, 2016 | @ TOR | L 4-3 | 4 | 0 | 0 | 0 | 0 | 0 | .322 | .397 | .706 | 1.103 |
| Sep 24, 2016 | @ TOR | L 3-0 | 4 | 0 | 0 | 0 | 0 | 0 | .330 | .405 | .722 | 1.127 |
| Sep 23, 2016 | @ TOR | L 9-0 | 4 | 0 | 2 | 0 | 0 | 0 | .337 | .413 | .738 | 1.152 |
| Sep 22, 2016 | @ TB | L 2-0 | 2 | 0 | 0 | 0 | 0 | 0 | .333 | .411 | .738 | 1.150 |
| Sep 21, 2016 | @ TB | W 11-5 | 4 | 3 | 3 | 2 | 5 | 0 | .337 | .410 | .747 | 1.157 |
| Sep 20, 2016 | @ TB | W 5-3 | 3 | 1 | 1 | 1 | 3 | 0 | .327 | .399 | .710 | 1.109 |
| Sep 18, 2016 | @ BOS | L 5-4 | 5 | 1 | 3 | 1 | 1 | 0 | .327 | .393 | .698 | 1.091 |
| Sep 17, 2016 | @ BOS | L 6-5 | 4 | 1 | 1 | 1 | 2 | 0 | .318 | .387 | .682 | 1.069 |
| Sep 16, 2016 | @ BOS | L 7-4 | 5 | 0 | 1 | 0 | 2 | 0 | .320 | .391 | .673 | 1.064 |
| Sep 15, 2016 | @ BOS | L 7-5 | 5 | 1 | 2 | 0 | 0 | 0 | .324 | .396 | .683 | 1.079 |
| Sep 14, 2016 |  vs LAD | L 2-0 | 4 | 0 | 0 | 0 | 0 | 0 | .321 | .396 | .686 | 1.082 |
| Sep 13, 2016 | vs LAD | W 3-0 | 4 | 1 | 1 | 1 | 1 | 0 | .331 | .406 | .706 | 1.112 |
| Sep 12, 2016 | vs LAD | L 8-2 | 3 | 0 | 0 | 0 | 0 | 0 | .333 | .411 | .697 | 1.108 |
| Sep 11, 2016 | vs TB | L 4-2 | 4 | 0 | 1 | 0 | 0 | 0 | .341 | .415 | .713 | 1.128 |
| Sep 10, 2016 | vs TB | W 5-1 | 2 | 1 | 1 | 1 | 2 | 0 | .344 | .420 | .728 | 1.148 |
| Sep 9, 2016 | vs TB | W 7-5 | 4 | 2 | 2 | 1 | 1 | 0 | .341 | .417 | .707 | 1.125 |
| Sep 8, 2016 | vs TB | W 5-4 | 4 | 0 | 0 | 0 | 0 | 0 | .336 | .410 | .689 | 1.100 |
| Sep 6, 2016 | vs TOR | W 7-6 | 4 | 0 | 1 | 0 | 0 | 0 | .348 | .423 | .713 | 1.136 |
| Sep 5, 2016 | vs TOR | W 5-3 | 4 | 0 | 1 | 0 | 0 | 0 | .351 | .429 | .730 | 1.158 |
| Sep 4, 2016 | @ BAL | W 5-2 | 2 | 0 | 0 | 0 | 0 | 0 | .355 | .434 | .748 | 1.182 |
| Sep 3, 2016 | @ BAL | L 2-0 | 4 | 0 | 1 | 0 | 0 | 0 | .362 | .432 | .762 | 1.194 |
| Sep 2, 2016 | @ BAL | L 8-0 | 2 | 0 | 0 | 0 | 0 | 0 | .366 | .439 | .782 | 1.221 |
| Aug 31, 2016 |  @ KC | W 5-4 F/13 | 5 | 1 | 1 | 0 | 0 | 0 | .374 | .441 | .798 | 1.239 |
| Aug 30, 2016 | @ KC | W 5-4 F/10 | 6 | 0 | 1 | 0 | 0 | 0 | .383 | .448 | .819 | 1.267 |
| Aug 29, 2016 | @ KC | L 8-5 | 4 | 1 | 1 | 0 | 0 | 0 | — | — | — | — |
| Aug 28, 2016 | vs BAL | L 5-0 | 4 | 0 | 2 | 0 | 0 | 0 | .405 | .468 | .893 | 1.361 |
| Aug 27, 2016 | vs BAL | W 13-5 | 3 | 1 | 1 | 1 | 1 | 0 | .400 | .467 | .900 | 1.367 |
| Aug 26, 2016 | vs BAL | W 14-4 | 5 | 3 | 3 | 1 | 4 | 0 | .403 | .459 | .883 | 1.342 |
| Aug 24, 2016 |  @ SEA | W 5-0 | 3 | 1 | 2 | 1 | 1 | 0 | .389 | .450 | .847 | 1.297 |
| Aug 23, 2016 | @ SEA | W 5-1 | 4 | 0 | 1 | 0 | 0 | 0 | .377 | .427 | .797 | 1.224 |
| Aug 22, 2016 | @ SEA | L 7-5 | 4 | 2 | 3 | 2 | 3 | 0 | .385 | .429 | .831 | 1.259 |
| Aug 21, 2016 |  @ LAA | L 2-0 | 3 | 0 | 0 | 0 | 0 | 0 | .361 | .409 | .738 | 1.147 |
| Aug 20, 2016 | @ LAA | W 5-1 | 4 | 1 | 1 | 1 | 1 | 0 | .379 | .419 | .776 | 1.195 |
| Aug 19, 2016 | @ LAA | W 7-0 | 4 | 0 | 3 | 0 | 0 | 1 | .389 | .431 | .759 | 1.190 |
| Aug 17, 2016 | vs TOR | L 7-4 | 3 | 1 | 2 | 1 | 1 | 0 | .360 | .396 | .720 | 1.116 |
| Aug 16, 2016 | vs TOR | L 12-6 | 4 | 2 | 3 | 2 | 4 | 0 | .340 | .367 | .660 | 1.027 |
| Aug 15, 2016 | vs TOR | W 1-0 | 3 | 0 | 2 | 0 | 0 | 0 | .302 | .333 | .512 | .845 |
| Aug 14, 2016 | vs TB | L 12-3 | 4 | 1 | 1 | 1 | 2 | 0 | .275 | .293 | .500 | .793 |
| Aug 13, 2016 | vs TB | W 8-4 | 4 | 0 | 0 | 0 | 0 | 0 | .278 | .297 | .444 | .742 |
| Aug 11, 2016 | @ BOS | W 4-2 | 4 | 1 | 1 | 0 | 0 | 0 | .313 | .333 | .500 | .833 |
| Aug 10, 2016 | @ BOS | W 9-4 | 5 | 2 | 4 | 1 | 1 | 0 | .321 | .345 | .536 | .881 |
| Aug 9, 2016 | @ BOS | L 5-3 | 4 | 0 | 0 | 0 | 0 | 0 | .217 | .250 | .348 | .598 |
| Aug 6, 2016 |  vs CLE | L 5-2 | 3 | 1 | 1 | 0 | 1 | 0 | .263 | .300 | .421 | .721 |
| Aug 5, 2016 | vs CLE | W 13-7 | 4 | 0 | 1 | 0 | 2 | 0 | .250 | .294 | .375 | .669 |
| Aug 4, 2016 |  vs NYM | L 4-1 | 4 | 1 | 2 | 0 | 0 | 0 | .250 | .250 | .333 | .583 |
| Aug 3, 2016 | vs NYM | W 9-5 | 4 | 1 | 1 | 0 | 0 | 0 | .125 | .125 | .125 | .250 |
| May 13, 2016 |  vs CHW | L 7-1 | 4 | 0 | 0 | 0 | 0 | 0 | .000 | .000 | .000 | .000 |
What the columns mean: AB · R · H · HR · RBI · SB · AVG · OBP · SLG · OPS
Answered about Gary Sanchez in 2016
Source: ESPN public MLB data, 2016 season.