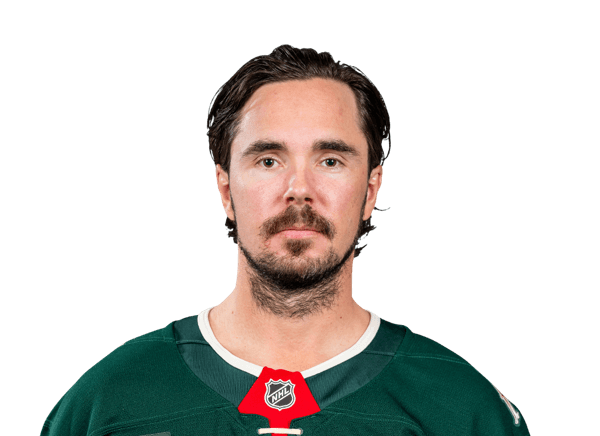
Marcus Johansson stats
Bio
- Age
- 36 yearsOct 6, 1990
- Height
- 6' 1"
Marcus Johansson played 16 NHL seasons, 2010-11 to 2025-26.
Stats
Totals
Career regular season
- GP
- 1,058
- G
- 200
- A
- 366
- PTS
- 566
- +/-
- -54
- PIM
- 166
- S
- 1,615
- HIT
- 579
- BLK
- 337
Ranked among NHL players with 20+ games that season; only the top 50 are shown. How each stat qualifies: glossary.
| GP: Games the player dressed and took a shift in. | G: Goals scored. | A: Assists — the last one or two passes or shots before a teammate’s goal. | PTS: Goals plus assists. | +/-: Goals for minus goals against while the player was on the ice at even strength or short-handed. | PIM: Penalty minutes — time served in the box. | S: Shots on goal. | HIT: Hits: body checks the arena scorer credited. | BLK: Blocked shots: opponents’ shots stopped before they reached the net. | ||
|---|---|---|---|---|---|---|---|---|---|---|
| 2010-11 | WSH | 69 | 13 | 14 | 27 | 2 | 10 | 102 | 47 | 22 |
| 2011-12 | WSH | 80 | 14 | 32 | 46 | -5 | 8 | 90 | 61 | 28 |
| 2012-13 | WSH | 34 | 6 | 16 | 22 | 3 | 4 | 40 | 14 | 6 |
| 2013-14 | WSH | 80 | 8 | 36 | 44 | -21 | 4 | 107 | 49 | 27 |
| 2014-15 | WSH | 82 | 20 | 27 | 47 | 6 | 10 | 138 | 69 | 18 |
| 2015-16 | WSH | 74 | 17 | 29 | 46 | 12 | 16 | 132 | 38 | 24 |
| 2016-17 | WSH | 82 | 24 | 34 | 58 | 25 | 10 | 129 | 32 | 22 |
| 2017-18 | NJ | 29 | 5 | 9 | 14 | -11 | 14 | 42 | 8 | 9 |
| 2018-19 |  BOS/NJ | 58 | 13 | 17 | 30 | -16 | 8 | 115 | 28 | 24 |
| 2019-20 | BUF | 60 | 9 | 21 | 30 | -12 | 20 | 87 | 39 | 22 |
| 2020-21 | MIN | 36 | 6 | 8 | 14 | -10 | 4 | 46 | 12 | 12 |
| 2021-22 |  WSH/SEA | 69 | 9 | 20 | 29 | -26 | 4 | 111 | 31 | 26 |
| 2022-23 |  WSH/MIN | 80 | 19 | 27 | 46 | 3 | 8 | 137 | 26 | 23 |
| 2023-24 | MIN | 78 | 11 | 19 | 30 | -15 | 22 | 112 | 42 | 29 |
| 2024-25 | MIN | 72 | 11 | 23 | 34 | -7 | 12 | 121 | 49 | 25 |
| 2025-26 | MIN | 75 | 15 | 34 | 49 | 18 | 12 | 106 | 34 | 20 |
What the columns mean: G · A · PTS · +/- · PIM · S · HIT · BLK
Career Postseason
- GP
- 125
- G
- 20
- A
- 31
- PTS
- 51
- +/-
- -19
- PIM
- 8
- S
- 202
- HIT
- 194
- BLK
- 52
Per game
Career regular season
- GP
- 1,058
- G
- 0.2
- A
- 0.3
- PTS
- 0.5
- +/-
- -54
- PIM
- 0.2
- S
- 1.5
- HIT
- 0.5
- BLK
- 0.3
Per game: season totals ÷ games played. Derived here — percentages, plus/minus, goals-against average and time on ice are the stored figures and are left as they are.
| GP: Games the player dressed and took a shift in. | G: Goals scored. | A: Assists — the last one or two passes or shots before a teammate’s goal. | PTS: Goals plus assists. | +/-: Goals for minus goals against while the player was on the ice at even strength or short-handed. | PIM: Penalty minutes — time served in the box. | S: Shots on goal. | HIT: Hits: body checks the arena scorer credited. | BLK: Blocked shots: opponents’ shots stopped before they reached the net. | ||
|---|---|---|---|---|---|---|---|---|---|---|
| 2010-11 | WSH | 69 | 0.2 | 0.2 | 0.4 | 2 | 0.1 | 1.5 | 0.7 | 0.3 |
| 2011-12 | WSH | 80 | 0.2 | 0.4 | 0.6 | -5 | 0.1 | 1.1 | 0.8 | 0.4 |
| 2012-13 | WSH | 34 | 0.2 | 0.5 | 0.6 | 3 | 0.1 | 1.2 | 0.4 | 0.2 |
| 2013-14 | WSH | 80 | 0.1 | 0.5 | 0.6 | -21 | 0.1 | 1.3 | 0.6 | 0.3 |
| 2014-15 | WSH | 82 | 0.2 | 0.3 | 0.6 | 6 | 0.1 | 1.7 | 0.8 | 0.2 |
| 2015-16 | WSH | 74 | 0.2 | 0.4 | 0.6 | 12 | 0.2 | 1.8 | 0.5 | 0.3 |
| 2016-17 | WSH | 82 | 0.3 | 0.4 | 0.7 | 25 | 0.1 | 1.6 | 0.4 | 0.3 |
| 2017-18 | NJ | 29 | 0.2 | 0.3 | 0.5 | -11 | 0.5 | 1.4 | 0.3 | 0.3 |
| 2018-19 | BOS/NJ | 58 | 0.2 | 0.3 | 0.5 | -16 | 0.1 | 2.0 | 0.5 | 0.4 |
| 2019-20 | BUF | 60 | 0.2 | 0.4 | 0.5 | -12 | 0.3 | 1.5 | 0.7 | 0.4 |
| 2020-21 | MIN | 36 | 0.2 | 0.2 | 0.4 | -10 | 0.1 | 1.3 | 0.3 | 0.3 |
| 2021-22 | WSH/SEA | 69 | 0.1 | 0.3 | 0.4 | -26 | 0.1 | 1.6 | 0.4 | 0.4 |
| 2022-23 | WSH/MIN | 80 | 0.2 | 0.3 | 0.6 | 3 | 0.1 | 1.7 | 0.3 | 0.3 |
| 2023-24 | MIN | 78 | 0.1 | 0.2 | 0.4 | -15 | 0.3 | 1.4 | 0.5 | 0.4 |
| 2024-25 | MIN | 72 | 0.2 | 0.3 | 0.5 | -7 | 0.2 | 1.7 | 0.7 | 0.3 |
| 2025-26 | MIN | 75 | 0.2 | 0.5 | 0.7 | 18 | 0.2 | 1.4 | 0.5 | 0.3 |
What the columns mean: G · A · PTS · +/- · PIM · S · HIT · BLK
Fantasy
Career regular season
- GP
- 1,058
- ESPN
- 1,235.4
- YAHOO
- 4,660.5
- ESPN/G
- 1.2
- YAHOO/G
- 4.4
Fantasy points in ESPN’s and Yahoo’s default points leagues, worked out here from the season lines. A season before 2009-10 is not scored: ESPN has no hits or blocked shots for it.
| GP: Games the player dressed and took a shift in. | ESPN: A goalie’s fantasy points in ESPN’s default points scoring, worked out here from the season line. | YAHOO: A goalie’s fantasy points in Yahoo’s default points scoring, worked out here from the season line. | ESPN/G: ESPN fantasy points per game played. | YAHOO/G: Yahoo fantasy points per game played. | ||
|---|---|---|---|---|---|---|
| 2010-11 | WSH | 69 | 67.9 | 257.8 | 1.0 | 3.7 |
| 2011-12 | WSH | 80 | 93.1 | 327.0 | 1.2 | 4.1 |
| 2012-13 | WSH | 34 | 38.9 | 156.0 | 1.1 | 4.6 |
| 2013-14 | WSH | 80 | 91.6 | 315.3 | 1.1 | 3.9 |
| 2014-15 | WSH | 82 | 104.2 | 412.2 | 1.3 | 5.0 |
| 2015-16 | WSH | 74 | 99.0 | 412.8 | 1.3 | 5.6 |
| 2016-17 | WSH | 82 | 118.6 | 506.1 | 1.4 | 6.2 |
| 2017-18 | NJ | 29 | 30.0 | 96.8 | 1.0 | 3.3 |
| 2018-19 | BOS/NJ | 58 | 73.8 | 259.5 | 1.3 | 4.5 |
| 2019-20 | BUF | 60 | 65.6 | 226.3 | 1.1 | 3.8 |
| 2020-21 | MIN | 36 | 34.8 | 113.4 | 1.0 | 3.2 |
| 2021-22 | WSH/SEA | 69 | 70.2 | 227.9 | 1.0 | 3.3 |
| 2022-23 | WSH/MIN | 80 | 102.8 | 410.3 | 1.3 | 5.1 |
| 2023-24 | MIN | 78 | 73.9 | 253.8 | 0.9 | 3.3 |
| 2024-25 | MIN | 72 | 78.0 | 289.9 | 1.1 | 4.0 |
| 2025-26 | MIN | 75 | 93.0 | 395.4 | 1.2 | 5.3 |
What the columns mean: ESPN/G
Bio
- Age
- 36 yearsOct 6, 1990
- Height
- 6' 1"
- Debut
- 2010
- Birthplace
- Landskrona, SWE
- Draft
- 2009Rd 1, Pk 24
Latest performance

Marcus Johansson
May 13 · @ COL · L 4-3 OT
- A
- 0
- G
- 1
- S
- 1
- +/-
- 0
- GWG
- 0
- PIM
- 0
- PPA
- 0
- PPG
- 0
Games
All games| Date | Opponent | G | A | PTS | +/- | S |
|---|---|---|---|---|---|---|
| Wed, May 13 | at COLL 4-3 OT | 1 | 0 | 1 | 0 | 1 |
| Mon, May 11 | vsCOLL 5-2 | 0 | 0 | 0 | -1 | 1 |
| Sat, May 09 | vsCOLW 5-1 | 0 | 0 | 0 | 0 | 0 |
| Tue, May 05 | atCOLL 5-2 | 1 | 0 | 1 | 0 | 4 |
| Sun, May 03 | atCOLL 9-6 | 1 | 0 | 1 | 1 | 1 |
| Thu, Apr 30 | vs DALW 5-2 | 0 | 0 | 0 | 0 | 0 |
What were Marcus Johansson's career stats?
Marcus Johansson played 16 seasons for the Capitals, the Devils, the Sabres and the Wild. He had 200 goals and 366 assists for 566 points in 1,058 games.
League leaderboards and awards
16 seasons, 13 postseasons, 2010-11 to 2025-26
All-time career rank
- 293rd in game-winning goals (39)
Among the 4,169 NHL players with a career line on file, regular season. A place deeper than 300th is not listed.
More on Marcus Johansson
Playoff series
Marcus Johansson played 125 games across 13 NHL postseasons in 22 series — 9 won, 13 lost.
| G: Goals scored. | G: Goals scored. | A: Assists — the last one or two passes or shots before a teammate’s goal. | PTS: Goals plus assists. | |||
|---|---|---|---|---|---|---|
| 2025-26 | DAL | Won 4-2 | 6 | 1 | 0 | 1 |
| 2025-26 | COL | Lost 1-4 | 5 | 3 | 0 | 3 |
| 2024-25 |  VGK | Lost 2-3 | 5 | 0 | 2 | 2 |
| 2022-23 | DAL | Lost 2-4 | 6 | 2 | 0 | 2 |
| 2021-22 |  FLA | Lost 2-4 | 6 | 1 | 1 | 2 |
| 2020-21 | VGK | Lost 1-2 | 3 | 0 | 0 | 0 |
| 2018-19 |  TOR | Won 3-2 | 5 | 1 | 0 | 1 |
| 2018-19 |  CBJ | Won 4-2 | 6 | 1 | 3 | 4 |
| 2018-19 |  CAR | Won 4-0 | 4 | 1 | 3 | 4 |
| 2018-19 |  STL | Lost 3-4 | 7 | 1 | 1 | 2 |
| 2017-18 |  TB | Lost 1-2 | 3 | 0 | 0 | 0 |
| 2016-17 | TOR | Won 4-2 | 6 | 2 | 3 | 5 |
| 2016-17 |  PIT | Lost 3-4 | 7 | 0 | 3 | 3 |
| 2015-16 |  PHI | Won 4-2 | 6 | 1 | 5 | 6 |
| 2015-16 | PIT | Lost 2-4 | 6 | 1 | 0 | 1 |
| 2014-15 |  NYI | Won 4-3 | 7 | 1 | 2 | 3 |
| 2014-15 |  NYR | Lost 3-4 | 7 | 0 | 1 | 1 |
| 2012-13 | NYR | Lost 3-4 | 7 | 1 | 1 | 2 |
| 2011-12 |  BOS | Won 4-3 | 7 | 1 | 2 | 3 |
| 2011-12 | NYR | Lost 3-4 | 7 | 0 | 0 | 0 |
| 2010-11 | NYR | Won 4-1 | 5 | 2 | 2 | 4 |
| 2010-11 | TB | Lost 0-4 | 4 | 0 | 2 | 2 |
Marcus Johansson’s playoff series, round by round
Totals, from NHL game logs since the 1995-96 postseason — earlier series are not counted.
Marcus Johansson against each club
- vs New York Rangers (67)
- vs Pittsburgh Penguins (59)
- vs Tampa Bay Lightning (52)
- vs New York Islanders (51)
- vs Philadelphia Flyers (51)
- vs Toronto Maple Leafs (51)
- vs Carolina Hurricanes (49)
- vs St. Louis Blues (45)
- vs Boston Bruins (43)
- vs Winnipeg Jets (43)
- vs Columbus Blue Jackets (42)
- vs Florida Panthers (42)
- vs Dallas Stars (40)
- vs New Jersey Devils (38)
- vs San Jose Sharks (38)
- vs Colorado Avalanche (37)
- vs Ottawa Senators (36)
- vs Detroit Red Wings (35)
- vs Montreal Canadiens (34)
- vs Buffalo Sabres (33)
- vs Anaheim Ducks (32)
- vs Los Angeles Kings (31)
- vs Vegas Golden Knights (29)
- vs Chicago Blackhawks (28)
- vs Nashville Predators (28)
- vs Vancouver Canucks (27)
- vs Edmonton Oilers (26)
- vs Calgary Flames (25)
- vs Arizona Coyotes (23)
- vs Minnesota Wild (15)
- vs Washington Capitals (15)
- vs Seattle Kraken (11)
- vs Utah Mammoth (6)
Similar players
Closest career per-game profiles to Marcus Johansson among NHL players at the same position.
- Frans NielsenAlike in Penalty Minutes, Goals91out of 100 on profile similarity
- Teddy PurcellAlike in Points, Penalty Minutes88out of 100 on profile similarity
- Josh BaileyAlike in Points, Plus/Minus86out of 100 on profile similarity
- Rich PeverleyAlike in Goals, Points86out of 100 on profile similarity
- Travis ZajacAlike in Points, Goals86out of 100 on profile similarity


Compare Marcus Johansson with Frans Nielsen, Teddy Purcell, Josh Bailey