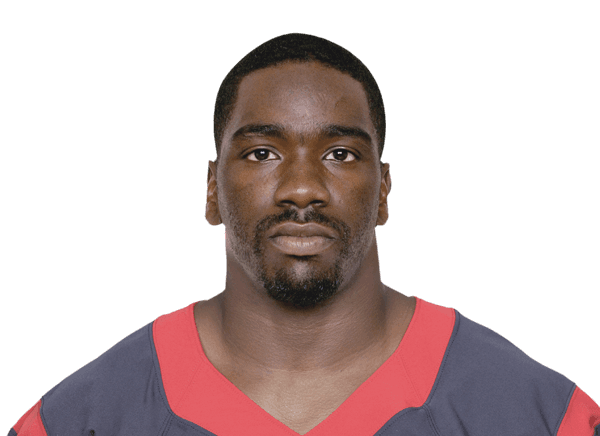
Ed Reed stats
Bio
- Age
- 48 yearsSep 11, 1978
- Height
- 5' 11"
- Defensive Player of the Year
- 2004
Ed Reed played 12 NFL seasons, 2002 to 2013.
Stats
Totals
Career regular season
- GP
- 174
- TOT
- 644
- SOLO
- 532
- AST
- 112
- SACK
- 6.0
- INT
- 64
- PD
- 140
- FF
- 11
Ranked among NFL players who qualify (TOT, SOLO, SACK, PD, FF: 8+ games; AST: 4+ games) that season; only the top 50 are shown. How each stat qualifies: glossary.
| GP: Games the player appeared in, however briefly. | TOT: Tackles made, solo and assisted together. | SOLO: Tackles made without help. | AST: Assisted tackles, where the player helped bring the carrier down. | SACK: Quarterbacks tackled behind the line of scrimmage. A shared sack counts as a half. | INT: Interceptions — thrown away by a quarterback, taken by a defender. | PD: Passes defensed — throws broken up before they were caught. | FF: Fumbles forced by knocking the ball loose. | ||
|---|---|---|---|---|---|---|---|---|---|
| 2002 | BAL | 16 | 85 | 71 | 14 | 1.0 | 5 | 12 | 0 |
| 2003 | BAL | 16 | 71 | 59 | 12 | 1.0 | 7 | 16 | 1 |
| 2004 | BAL | 16 | 76 | 62 | 14 | 2.0 | 9 | 17 | 3 |
| 2005 | BAL | 10 | 37 | 33 | 4 | 0.0 | 1 | 9 | 0 |
| 2006 | BAL | 16 | 60 | 52 | 8 | 0.0 | 5 | 9 | 1 |
| 2007 | BAL | 16 | 39 | 29 | 10 | 0.0 | 7 | 13 | 0 |
| 2008 | BAL | 16 | 41 | 34 | 7 | 1.0 | 9 | 16 | 1 |
| 2009 | BAL | 12 | 50 | 42 | 8 | 0.0 | 3 | 5 | 3 |
| 2010 | BAL | 10 | 37 | 30 | 7 | 0.0 | 8 | 16 | 1 |
| 2011 | BAL | 16 | 52 | 44 | 8 | 1.0 | 3 | 8 | 1 |
| 2012 | BAL | 16 | 58 | 49 | 9 | 0.0 | 4 | 15 | 0 |
| 2013 |  HOU/NYJ | 14 | 38 | 27 | 11 | 0.0 | 3 | 4 | 0 |
What the columns mean: TOT · SOLO · AST · SACK · INT · PD · FF
Career Postseason
- GP
- 15
- TOT
- 46
- SOLO
- 39
- AST
- 7
- SACK
- 0.0
- INT
- 9
- PD
- 19
- FF
- 0
Per game
Career regular season
- GP
- 174
- TOT
- 3.7
- SOLO
- 3.1
- AST
- 0.6
- SACK
- 0.0
- INT
- 0.4
- PD
- 0.8
- FF
- 0.1
Per game: season totals ÷ games played. Derived here — averages, completion rate and longest plays are the stored figures and are left as they are.
| GP: Games the player appeared in, however briefly. | TOT: Tackles made, solo and assisted together. | SOLO: Tackles made without help. | AST: Assisted tackles, where the player helped bring the carrier down. | SACK: Quarterbacks tackled behind the line of scrimmage. A shared sack counts as a half. | INT: Interceptions — thrown away by a quarterback, taken by a defender. | PD: Passes defensed — throws broken up before they were caught. | FF: Fumbles forced by knocking the ball loose. | ||
|---|---|---|---|---|---|---|---|---|---|
| 2002 | BAL | 16 | 5.3 | 4.4 | 0.9 | 0.1 | 0.3 | 0.8 | 0.0 |
| 2003 | BAL | 16 | 4.4 | 3.7 | 0.8 | 0.1 | 0.4 | 1.0 | 0.1 |
| 2004 | BAL | 16 | 4.8 | 3.9 | 0.9 | 0.1 | 0.6 | 1.1 | 0.2 |
| 2005 | BAL | 10 | 3.7 | 3.3 | 0.4 | 0.0 | 0.1 | 0.9 | 0.0 |
| 2006 | BAL | 16 | 3.8 | 3.3 | 0.5 | 0.0 | 0.3 | 0.6 | 0.1 |
| 2007 | BAL | 16 | 2.4 | 1.8 | 0.6 | 0.0 | 0.4 | 0.8 | 0.0 |
| 2008 | BAL | 16 | 2.6 | 2.1 | 0.4 | 0.1 | 0.6 | 1.0 | 0.1 |
| 2009 | BAL | 12 | 4.2 | 3.5 | 0.7 | 0.0 | 0.3 | 0.4 | 0.3 |
| 2010 | BAL | 10 | 3.7 | 3.0 | 0.7 | 0.0 | 0.8 | 1.6 | 0.1 |
| 2011 | BAL | 16 | 3.3 | 2.8 | 0.5 | 0.1 | 0.2 | 0.5 | 0.1 |
| 2012 | BAL | 16 | 3.6 | 3.1 | 0.6 | 0.0 | 0.3 | 0.9 | 0.0 |
| 2013 | HOU/NYJ | 14 | 2.7 | 1.9 | 0.8 | 0.0 | 0.2 | 0.3 | 0.0 |
What the columns mean: TOT · SOLO · AST · SACK · INT · PD · FF
Bio
- Age
- 48 yearsSep 11, 1978
- Height
- 5' 11"
- Debut
- 2002
- Birthplace
- Saint Rose, LA
- Draft
- 2002Rd 1, Pk 24
- College
- Miami
- Defensive Player of the Year
- 2004
Latest performance

Ed Reed
Dec 29 · @ MIA · W 20-7
- TOT
- 4
- SOLO
- 4
- AST
- 0
- SACK
- 0.0
- INT
- 1
- PD
- 1
2002 NFL combine
S, 5'11", 201 lb · Miami (FL)
| Measure | Result | Percentile |
|---|---|---|
| 40-yard dash | 4.57s | 28th |
Percentile: the share of Ss measured at the combine since 2000 he beat. The 2002 combine
Games
All games| Date | Opponent | TOT | SOLO | SACK | INT |
|---|---|---|---|---|---|
| Sun, Dec 29 | at MIAW 20-7 | 4 | 4 | 0 | 1 |
| Sun, Dec 22 | vs CLEW 24-13 | 0 | 0 | 0 | 1 |
| Sun, Dec 15 | at CARL 30-20 | 3 | 2 | 0 | 0 |
| Sun, Dec 08 | vs LVW 37-27 | 3 | 3 | 0 | 1 |
| Sun, Dec 01 | vsMIAL 23-3 | 4 | 2 | 0 | 0 |
| Sun, Nov 24 | at BALL 19-3 | 5 | 1 | 0 | 0 |
What were Ed Reed's career stats?
Ed Reed played 12 seasons for the Ravens. He recorded 644 tackles, 6 sacks and 64 interceptions. His best season was 2002: 85 tackles and 1.0 sack.
League leaderboards and awards
12 seasons, 7 postseasons, 2002 to 2013
Championships
- 2012 Super Bowl with the Baltimore Ravens
Awards
All-time career rank
- 257th in tackles (644)
Among the 9,779 NFL players with a career line on file, regular season. A place deeper than 300th is not listed.
More on Ed Reed
Playoff games
Ed Reed played 15 games across 7 NFL postseasons — 9 won, 6 lost.
| TOT: Tackles made, solo and assisted together. | SACK: Quarterbacks tackled behind the line of scrimmage. A shared sack counts as a half. | INT: Interceptions — thrown away by a quarterback, taken by a defender. | |||
|---|---|---|---|---|---|
| 2012 |  IND | W 24-9 | 5 | 0.0 | 0 |
| 2012 |  DEN | W 38-35 2OT | 3 | 0.0 | 0 |
| 2012 |  NE | W 28-13 | 2 | 0.0 | 0 |
| 2012 |  SF | W 34-31 | 5 | 0.0 | 1 |
| 2011 |  HOU | W 20-13 | 6 | 0.0 | 1 |
| 2011 | NE | L 23-20 | 4 | 0.0 | 0 |
| 2010 |  KC | W 30-7 | 4 | 0.0 | 0 |
| 2010 |  PIT | L 31-24 | 3 | 0.0 | 0 |
| 2009 | NE | W 33-14 | 4 | 0.0 | 1 |
| 2009 | IND | L 20-3 | 2 | 0.0 | 1 |
| 2008 | MIA | W 27-9 | 1 | 0.0 | 2 |
| 2008 |  TEN | W 13-10 | 4 | 0.0 | 0 |
| 2008 | PIT | L 23-14 | 2 | 0.0 | 0 |
| 2006 | IND | L 15-6 | 1 | 0.0 | 2 |
| 2003 | TEN | L 20-17 | 0 | 0.0 | 1 |
Totals, from NFL game logs since the 1994 postseason — earlier games are not counted.
Ed Reed against each club
- vs Cleveland Browns (22)
- vs Pittsburgh Steelers (22)
- vs Cincinnati Bengals (21)
- vs Indianapolis Colts (11)
- vs Miami Dolphins (9)
- vs Denver Broncos (7)
- vs Houston Texans (7)
- vs Kansas City Chiefs (7)
- vs New England Patriots (7)
- vs Tennessee Titans (7)
- vs Las Vegas Raiders (6)
- vs Los Angeles Chargers (6)
- vs Buffalo Bills (5)
- vs Jacksonville Jaguars (5)
- vs San Francisco 49ers (5)
- vs Arizona Cardinals (4)
- vs Carolina Panthers (4)
- vs Los Angeles Rams (4)
- vs New York Jets (4)
- vs Seattle Seahawks (4)
- vs Atlanta Falcons (3)
- vs Dallas Cowboys (3)
- vs New Orleans Saints (3)
- vs New York Giants (3)
- vs Philadelphia Eagles (3)
- vs Tampa Bay Buccaneers (3)
- vs Washington Commanders (3)
- vs Baltimore Ravens (2)
- vs Minnesota Vikings (2)
- vs Chicago Bears (1)
- vs Detroit Lions (1)
- vs Green Bay Packers (1)
Similar players
Closest career per-game profiles to Ed Reed among NFL players at the same position.
- Darren SharperAlike in Solo tackles56out of 100 on profile similarity
- Rod WoodsonAlike in Passes defended, Tackles, Solo tackles50out of 100 on profile similarity
- Ty LawAlike in Passes defended, Tackles, Solo tackles48out of 100 on profile similarity
- Aeneas WilliamsAlike in Tackles, Solo tackles, Passes defended47out of 100 on profile similarity
- Donnie AbrahamAlike in Tackles, Solo tackles46out of 100 on profile similarity

Compare Ed Reed with Darren Sharper, Rod Woodson, Ty Law