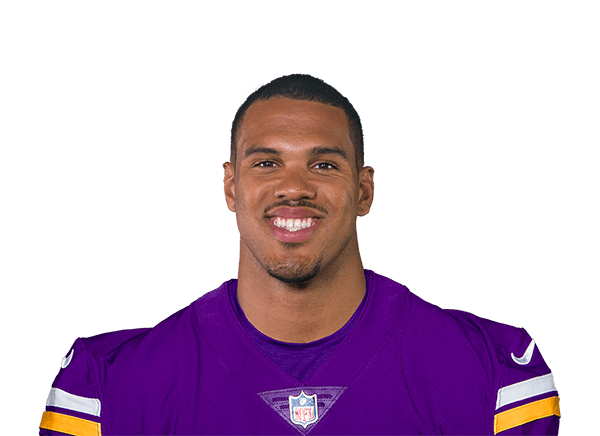
Anthony Barr stats
Bio
- Age
- 34 yearsMar 18, 1992
- Height
- 6' 5"
Anthony Barr played 10 NFL seasons, 2014 to 2023.
Stats
Totals
Career regular season
- GP
- 116
- TOT
- 554
- SOLO
- 371
- AST
- 183
- SACK
- 18.5
- INT
- 5
- PD
- 32
- FF
- 8
Ranked among NFL players who qualify (TOT, SOLO, SACK, PD, FF: 8+ games; AST: 4+ games) that season; only the top 50 are shown. How each stat qualifies: glossary.
Career Postseason
- GP
- 7
- TOT
- 37
- SOLO
- 26
- AST
- 11
- SACK
- 0.0
- INT
- 1
- PD
- 2
- FF
- 1
Bio
- Age
- 34 yearsMar 18, 1992
- Height
- 6' 5"
- Debut
- 2014
- Birthplace
- San Pedro, CA
- Draft
- 2014Rd 1, Pk 9
- College
- UCLA
Latest performance

Anthony Barr
Jan 07 · @ DET · L 30-20
- TOT
- 0
- SOLO
- 0
- AST
- 0
- SACK
- 0.0
- INT
- 0
- PD
- 0
2014 NFL combine
OLB, 6'5", 255 lb · UCLA
| Measure | Result | Percentile |
|---|---|---|
| 40-yard dash | 4.66s | 55th |
| Vertical jump | 34.5" | 53rd |
| Broad jump | 9' 11" | 58th |
| Bench press (225 lb) | 15 reps | 3rd |
| 3-cone drill | 6.82s | 94th |
| 20-yard shuttle | 4.19s | 76th |
Percentile: the share of OLBs measured at the combine since 2000 he beat. The 2014 combine
Games
All games| Date | Opponent | TOT | SOLO | SACK | INT |
|---|---|---|---|---|---|
| Sun, Jan 07 | at DETL 30-20 | 0 | 0 | 0 | 0 |
| Sun, Dec 31 | vs GBL 33-10 | 0 | 0 | 0 | 0 |
| Mon, Nov 27 | vs CHIL 12-10 | 0 | 0 | 0 | 0 |
| Sun, Nov 19 | at DENL 21-20 | 1 | 1 | 0 | 0 |
| Sun, Jan 22 | at SFL 19-12 | 5 | 2 | 0 | 0 |
| Mon, Jan 16 | at TBW 31-14 | 4 | 3 | 0 | 0 |
What were Anthony Barr's career stats?
Anthony Barr played 10 seasons for the Vikings and the Cowboys. He recorded 554 tackles, 18.5 sacks and 5 interceptions. His best season was 2019: 79 tackles and 1.5 sacks.
Anthony Barr college stats
Anthony Barr played 4 seasons at UCLA Bruins (2010 to 2013): 144 tackles, 23.5 sacks and 0 interceptions.
rushing
receiving
defensive
scoring
returning
College seasons as ESPN files them for the school he played for.
More on Anthony Barr
Playoff games
Anthony Barr played 7 games across 4 NFL postseasons — 3 won, 4 lost.
| TOT: Tackles made, solo and assisted together. | SACK: Quarterbacks tackled behind the line of scrimmage. A shared sack counts as a half. | INT: Interceptions — thrown away by a quarterback, taken by a defender. | |||
|---|---|---|---|---|---|
| 2022 | TB | W 31-14 | 4 | 0.0 | 0 |
| 2022 | SF | L 19-12 | 5 | 0.0 | 0 |
| 2019 |  NO | W 26-20 OT | 8 | 0.0 | 0 |
| 2019 | SF | L 27-10 | 8 | 0.0 | 0 |
| 2017 | NO | W 29-24 | 4 | 0.0 | 1 |
| 2017 |  PHI | L 38-7 | 3 | 0.0 | 0 |
| 2015 |  SEA | L 10-9 | 5 | 0.0 | 0 |
Totals, from NFL game logs since the 1994 postseason — earlier games are not counted.
Anthony Barr against each club
- vs Green Bay Packers (16)
- vs Detroit Lions (13)
- vs Chicago Bears (12)
- vs Los Angeles Rams (6)
- vs Philadelphia Eagles (6)
- vs Washington Commanders (6)
- vs San Francisco 49ers (5)
- vs Atlanta Falcons (4)
- vs Carolina Panthers (4)
- vs New Orleans Saints (4)
- vs New York Giants (4)
- vs Seattle Seahawks (4)
- vs Tampa Bay Buccaneers (4)
- vs Dallas Cowboys (3)
- vs Denver Broncos (3)
- vs Indianapolis Colts (3)
- vs Arizona Cardinals (2)
- vs Baltimore Ravens (2)
- vs Buffalo Bills (2)
- vs Cincinnati Bengals (2)
- vs Houston Texans (2)
- vs Jacksonville Jaguars (2)
- vs Kansas City Chiefs (2)
- vs Los Angeles Chargers (2)
- vs New England Patriots (2)
- vs Pittsburgh Steelers (2)
- vs Tennessee Titans (2)
- vs Cleveland Browns (1)
- vs Las Vegas Raiders (1)
- vs Miami Dolphins (1)
- vs New York Jets (1)
Similar players
Closest career per-game profiles to Anthony Barr among NFL players at the same position.
- Mychal KendricksAlike in Forced fumbles, Interceptions, Passes defended76out of 100 on profile similarity
- Perry Riley Jr.Alike in Solo tackles, Passes defended, Interceptions70out of 100 on profile similarity
- Josey JewellAlike in Solo tackles, Passes defended, Interceptions69out of 100 on profile similarity
- Jerome BakerAlike in Interceptions, Forced fumbles, Solo tackles68out of 100 on profile similarity
- Wesley WoodyardAlike in Interceptions, Solo tackles, Tackles67out of 100 on profile similarity


Compare Anthony Barr with Mychal Kendricks, Perry Riley Jr., Josey Jewell