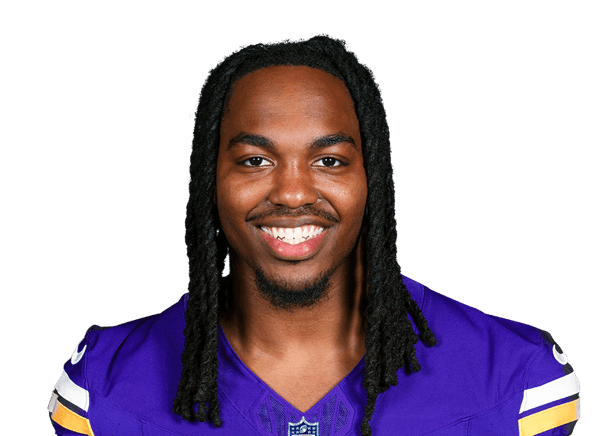
Jordan Mason stats
VikingsBio
- Age
- 27 yearsMay 24, 1999
- Height
- 5' 11"
- Weight
- 230 lbs

Jordan Mason recorded 182 rushing yards, 1 rushing touchdown and 4.1 yards per carry in 4 games of 2026 for the Minnesota Vikings. Last game: .
Stats
Totals
 Vikings
- GP
- 4
- CAR
- 44
- YDS
- 182
- AVG
- 4.1
- TD
- 1
- LNG · 44th
- 28
- FD
- 8
- FUM
- 0
Ranked among NFL players who qualify (CAR, YDS, TD: 4+ games, 50+ CAR; AVG: 4+ games, 100+ CAR; LNG, FD: 4+ games) that season; only the top 50 are shown. How each stat qualifies: glossary.
Career regular season
- GP
- 65
- CAR
- 439
- YDS
- 2,193
- AVG
- 5.0
- TD
- 14
- LNG
- 55
- FD
- 113
- FUM
- 5
Career Postseason
- GP
- 3
- CAR
- 2
- YDS
- 12
- AVG
- 6.0
- TD
- 0
- LNG
- 8
- FD
- 1
- FUM
- 0
Per game
- GP
- 4
- CAR
- 11
- YDS
- 45.5
- AVG
- 4.1
- TD
- 0.3
- LNG
- 28
- FD
- 2
- FUM
- 0
Per game: season totals ÷ games played. Derived here — averages, completion rate and longest plays are the stored figures and are left as they are.
Career regular season, Per game
- GP
- 65
- CAR
- 6.8
- YDS
- 33.7
- AVG
- 5.0
- TD
- 0.2
- LNG
- 55
- FD
- 1.7
- FUM
- 0.1
Fantasy
- GP
- 4
- PPR
- 26.9
- HALF
- 25.9
- STD
- 24.9
- PPG
- 6.7
Fantasy points in ESPN’s default scoring, worked out here from the season lines: PPR with a point per catch, half-PPR with half, standard with none.
Career regular season
- GP
- 65
- PPR
- 347.3
- HALF
- 332.3
- STD
- 317.3
- PPG
- 5.3
Bio
- Age
- 27 yearsMay 24, 1999
- Height
- 5' 11"
- Weight
- 230 lbs
- Experience
- 5 years
- Birthplace
- Gallatin, TN
- College
- Georgia Tech
- Salary
- $5 million2026
Latest performance

Jordan Mason
Nov 09 · vs BUF · L 23-6
- CAR
- 6
- YDS
- 35
- AVG
- 5.8
- TD
- 0
- LNG
- 11
- FUM
- 0
Snap counts, 2026
46% of his club's offensive snaps a game (105 in 4 games); 48% in week 9.
| Wk | Opp | Snaps | Snap % | ST |
|---|---|---|---|---|
| 1 | GB | 29 | 45% | 0 |
| 7 | IND | 38 | 64% | 0 |
| 8 | DET | 15 | 28% | 0 |
| 9 | BUF | 23 | 48% | 0 |
Injury history
Jordan Mason has been on the NFL’s game-status report 1 week since 2026.
| Season | Out | D / Q | Injuries listed |
|---|---|---|---|
| 2026 | 0 | 1 | Thumb |
From the weekly injury reports clubs file (nflverse), regular season and playoffs; a practice-only listing counts no week. A player moved to injured reserve leaves the report, so a season-ending injury shows only up to that move.
Games
All gamesNext
at GBSun, Nov 15
vs GB since 2024
- 5
- GP
- 40
- ATT
- 203
- YDS
- 1
- TD
| Date | Opponent | ATT | YDS | TD |
|---|---|---|---|---|
| Mon, Nov 09 | vs BUFL 23-6 | 6 | 35 | 0 |
| Sun, Nov 01 | at DETL 19-15 | 8 | 20 | 0 |
| Sun, Oct 25 | vs INDW 16-10 | 15 | 68 | 0 |
| Sun, Sep 13 | vs GBW 39-22 | 15 | 59 | 1 |
| Sun, Jan 04 | vsGBW 16-3 | 14 | 94 | 0 |
| Sun, Dec 21 | at NYGW 16-13 | 2 | 5 | 0 |
What are Jordan Mason's career stats?
Jordan Mason has played 5 seasons for the 49ers and the Vikings. He has had 439 carries for 2,193 yards, 30 catches for 180 yards and has scored 14 touchdowns. His best season so far is 2024: 789 rushing yards, 3 rushing touchdowns and 5.2 yards per carry.
Best single games
- Rushing Yards: 147 vs NYJ on Sep 9, 2024, W 32-19
- Rushing Touchdowns: 2 vs CIN on Sep 21, 2025, W 48-10
- Receptions: 3 @ CLE on Oct 5, 2025, W 21-17
- Receiving Yards: 37 vs NE on Sep 29, 2024, W 30-13
Regular season only, from NFL game logs since 2022.
Jordan Mason college stats
Jordan Mason played 4 seasons at Georgia Tech Yellow Jackets (2018 to 2021): 2,349 rushing yards and 17 rushing touchdowns on 449 carries.
rushing
receiving
defensive
scoring
College seasons as ESPN files them for the school he played for. Game by game: Jordan Mason's college game log.
More on Jordan Mason
Playoff games
Jordan Mason played 6 games across 2 NFL postseasons — 4 won, 2 lost.
| CAR: Times the player ran with the ball. | YDS: Yards gained through the air, on the ground or after a catch, whichever this table counts. | TD: Touchdowns, worth six points before the extra point. | |||
|---|---|---|---|---|---|
| 2023 | GB | W 24-21 | 0 | 0 | 0 |
| 2023 | DET | W 34-31 | 0 | 0 | 0 |
| 2023 |  KC | L 25-22 OT | 0 | 0 | 0 |
| 2022 |  SEA | W 41-23 | 2 | 12 | 0 |
| 2022 |  DAL | W 19-12 | 0 | 0 | 0 |
| 2022 |  PHI | L 31-7 | 0 | 0 | 0 |
What the columns mean: CAR
Totals, from NFL game logs since the 1994 postseason — earlier games are not counted.
Jordan Mason against each club
- vs Seattle Seahawks (8)
- vs Arizona Cardinals (5)
- vs Green Bay Packers (5)
- vs Los Angeles Rams (5)
- vs Dallas Cowboys (4)
- vs Chicago Bears (3)
- vs Detroit Lions (3)
- vs Philadelphia Eagles (3)
- vs Tampa Bay Buccaneers (3)
- vs Washington Commanders (3)
- vs Atlanta Falcons (2)
- vs Baltimore Ravens (2)
- vs Buffalo Bills (2)
- vs Cincinnati Bengals (2)
- vs Cleveland Browns (2)
- vs Kansas City Chiefs (2)
- vs Los Angeles Chargers (2)
- vs Minnesota Vikings (2)
- vs New York Giants (2)
- vs Pittsburgh Steelers (2)
- vs Carolina Panthers (1)
- vs Denver Broncos (1)
- vs Indianapolis Colts (1)
- vs Jacksonville Jaguars (1)
- vs Las Vegas Raiders (1)
- vs Miami Dolphins (1)
- vs New England Patriots (1)
- vs New Orleans Saints (1)
- vs New York Jets (1)
Similar players
Closest career per-game profiles to Jordan Mason among NFL players at the same position.
- Blake CorumLARAlike in Yards per carry77out of 100 on profile similarity
- Emanuel WilsonSEAAlike in Yards per carry77out of 100 on profile similarity
- Rashaad PennyAlike in Yards per carry75out of 100 on profile similarity
- Raheem MostertAlike in Yards per carry74out of 100 on profile similarity
- Jeff Wilson Jr.Alike in First downs, Carries72out of 100 on profile similarity


Compare Jordan Mason with Blake Corum, Emanuel Wilson, Rashaad Penny