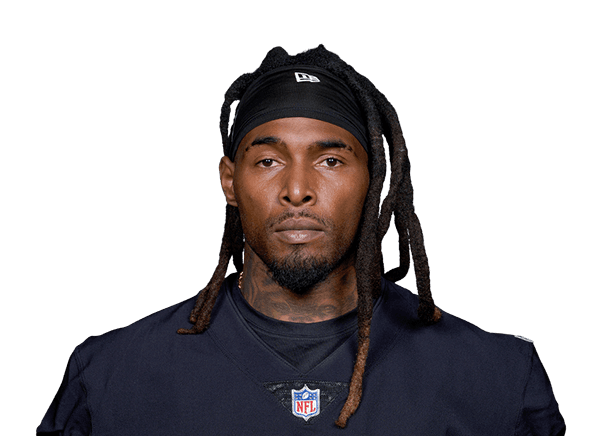
Brandon Bolden stats
Bio
- Age
- 36 yearsJan 26, 1990
- Height
- 5' 11"
Brandon Bolden played 11 NFL seasons, 2012 to 2023.
Stats
Totals
Career regular season
- GP
- 164
- CAR
- 304
- YDS
- 1,394
- AVG
- 4.6
- TD
- 13
- LNG
- 54
- FD
- 74
- FUM
- 2
Ranked among NFL players who qualify (CAR, YDS, TD: 4+ games, 50+ CAR; AVG: 4+ games, 100+ CAR; LNG, FD: 4+ games) that season; only the top 50 are shown. How each stat qualifies: glossary.
Career Postseason
- GP
- 9
- CAR
- 12
- YDS
- 46
- AVG
- 3.8
- TD
- 1
- LNG
- 20
- FD
- 4
- FUM
- 0
Per game
Career regular season
- GP
- 164
- CAR
- 1.9
- YDS
- 8.5
- AVG
- 4.6
- TD
- 0.1
- LNG
- 54
- FD
- 0.5
- FUM
- 0.0
Per game: season totals ÷ games played. Derived here — averages, completion rate and longest plays are the stored figures and are left as they are.
Bio
- Age
- 36 yearsJan 26, 1990
- Height
- 5' 11"
- Debut
- 2012
- Birthplace
- Baton Rouge, LA
- College
- Ole Miss
Latest performance

Brandon Bolden
Jan 07 · vs DEN · W 27-14
- CAR
- 0
- YDS
- 0
- AVG
- 0.0
- TD
- 0
- LNG
- 0
- FUM
- 0
2012 NFL combine
RB, 5'11", 222 lb · Mississippi
| Measure | Result | Percentile |
|---|---|---|
| 40-yard dash | 4.55s | 56th |
| Vertical jump | 38" | 86th |
| Broad jump | 9' 11" | 54th |
| Bench press (225 lb) | 21 reps | 55th |
| 3-cone drill | 6.96s | 72nd |
| 20-yard shuttle | 4.44s | 17th |
Percentile: the share of RBs measured at the combine since 2000 he beat. The 2012 combine
Games
All games| Date | Opponent | ATT | YDS | TD |
|---|---|---|---|---|
| Sun, Jan 07 | vs DENW 27-14 | 0 | 0 | 0 |
| Sun, Dec 31 | at INDL 23-20 | 2 | 6 | 0 |
| Mon, Dec 25 | at KCW 20-14 | 0 | 0 | 0 |
| Thu, Dec 14 | vs LACW 63-21 | 2 | 25 | 1 |
| Sun, Dec 10 | vs MINL 3-0 | 0 | 0 | 0 |
| Sun, Nov 26 | vsKCL 31-17 | 0 | 0 | 0 |
What were Brandon Bolden's career stats?
Brandon Bolden played 11 seasons for the Patriots, the Dolphins and the Raiders. He had 304 carries for 1,394 yards, 109 catches for 959 yards and scored 20 touchdowns. His best season was 2012: 274 rushing yards, 2 rushing touchdowns and 4.9 yards per carry.
League leaderboards and awards
11 seasons, 4 postseasons, 2012 to 2023
Championships ×2
- 2014 Super Bowl with the New England Patriots
- 2016 Super Bowl with the New England Patriots
Brandon Bolden college stats
Brandon Bolden played 4 seasons at Ole Miss Rebels (2008 to 2011): 2,604 rushing yards and 27 rushing touchdowns on 486 carries.
passing
rushing
receiving
defensive
scoring
returning
College seasons as ESPN files them for the school he played for.
More on Brandon Bolden
Playoff games
Brandon Bolden played 17 games across 8 NFL postseasons — 11 won, 6 lost.
| CAR: Times the player ran with the ball. | YDS: Yards gained through the air, on the ground or after a catch, whichever this table counts. | TD: Touchdowns, worth six points before the extra point. | |||
|---|---|---|---|---|---|
| 2021 |  BUF | L 47-17 | 0 | 0 | 0 |
| 2019 |  TEN | L 20-13 | 0 | 0 | 0 |
| 2017 | TEN | W 35-14 | 4 | 27 | 1 |
| 2017 |  JAX | W 24-20 | 0 | 0 | 0 |
| 2017 |  PHI | L 41-33 | 0 | 0 | 0 |
| 2016 |  HOU | W 34-16 | 0 | 0 | 0 |
| 2016 |  PIT | W 36-17 | 0 | 0 | 0 |
| 2016 |  ATL | W 34-28 OT | 0 | 0 | 0 |
| 2015 | KC | W 27-20 | 0 | 0 | 0 |
| 2015 | DEN | L 20-18 | 5 | 12 | 0 |
| 2014 |  BAL | W 35-31 | 3 | 7 | 0 |
| 2014 | IND | W 45-7 | 0 | 0 | 0 |
| 2014 |  SEA | W 28-24 | 0 | 0 | 0 |
| 2013 | IND | W 43-22 | 0 | 0 | 0 |
| 2013 | DEN | L 26-16 | 0 | 0 | 0 |
| 2012 | HOU | W 41-28 | 0 | 0 | 0 |
| 2012 | BAL | L 28-13 | 0 | 0 | 0 |
What the columns mean: CAR
Totals, from NFL game logs since the 1994 postseason — earlier games are not counted.
Brandon Bolden against each club
- vs Buffalo Bills (18)
- vs Miami Dolphins (15)
- vs New York Jets (14)
- vs Denver Broncos (12)
- vs Houston Texans (11)
- vs Indianapolis Colts (8)
- vs Pittsburgh Steelers (8)
- vs Kansas City Chiefs (7)
- vs Los Angeles Chargers (7)
- vs Tennessee Titans (7)
- vs Jacksonville Jaguars (6)
- vs Baltimore Ravens (5)
- vs Atlanta Falcons (4)
- vs Cincinnati Bengals (4)
- vs New England Patriots (4)
- vs New Orleans Saints (4)
- vs Seattle Seahawks (4)
- vs Chicago Bears (3)
- vs Dallas Cowboys (3)
- vs Detroit Lions (3)
- vs Green Bay Packers (3)
- vs Las Vegas Raiders (3)
- vs Minnesota Vikings (3)
- vs New York Giants (3)
- vs Philadelphia Eagles (3)
- vs San Francisco 49ers (3)
- vs Tampa Bay Buccaneers (3)
- vs Arizona Cardinals (2)
- vs Carolina Panthers (2)
- vs Cleveland Browns (2)
- vs Los Angeles Rams (2)
- vs Washington Commanders (2)
Similar players
Closest career per-game profiles to Brandon Bolden among NFL players at the same position.
- Jordan TodmanAlike in Yards per carry90out of 100 on profile similarity
- Pierre Strong Jr.GBAlike in Yards per carry80out of 100 on profile similarity
- Chris PolkAlike in Yards per carry79out of 100 on profile similarity
- Justice HillBALAlike in Yards per carry77out of 100 on profile similarity
- Chris BrooksGBAlike in Yards per carry76out of 100 on profile similarity


Compare Brandon Bolden with Jordan Todman, Pierre Strong Jr., Chris Polk