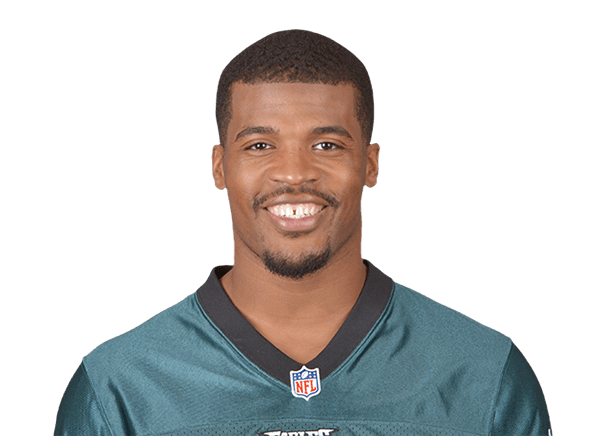
Brad Smith stats
Bio
- Age
- 42 yearsDec 12, 1983
- Height
- 6' 2"
Brad Smith played 9 NFL seasons, 2006 to 2014.
Stats
Totals
Career regular season
- GP
- 125
- REC
- 104
- TGTS
- 189
- YDS
- 987
- AVG
- 9.5
- TD
- 5
- LNG
- 36
- FD
- 47
Career Postseason
- GP
- 6
- REC
- 7
- TGTS
- 8
- YDS
- 41
- AVG
- 5.9
- TD
- 0
- LNG
- 16
- FD
- 1
Per game
Career regular season
- GP
- 125
- REC
- 0.8
- TGTS
- 1.5
- YDS
- 7.9
- AVG
- 9.5
- TD
- 0.0
- LNG
- 36
- FD
- 0.4
Per game: season totals ÷ games played. Derived here — averages, completion rate and longest plays are the stored figures and are left as they are.
Bio
- Age
- 42 yearsDec 12, 1983
- Height
- 6' 2"
- Debut
- 2006
- Birthplace
- Youngstown, OH
- Draft
- 2006Rd 4, Pk 103
- College
- Missouri
Latest performance

Brad Smith
Dec 28 · @ NYG · W 34-26
- REC
- 0
- TGTS
- 0
- YDS
- 0
- AVG
- 0.0
- TD
- 0
- LNG
- 0
2006 NFL combine
WR, 6'2", 213 lb · Missouri
| Measure | Result | Percentile |
|---|---|---|
| 40-yard dash | 4.46s | 65th |
| Vertical jump | 39.5" | 88th |
| Broad jump | 10' 8" | 85th |
| 3-cone drill | 7.00s | 43rd |
| 20-yard shuttle | 4.33s | 25th |
Percentile: the share of WRs measured at the combine since 2000 he beat. The 2006 combine
Games
All games| Date | Opponent | REC | YDS | TD |
|---|---|---|---|---|
| Sun, Dec 28 | at NYGW 34-26 | 0 | 0 | 0 |
| Sun, Dec 14 | vs DALL 38-27 | 0 | 0 | 0 |
| Sun, Dec 07 | vs SEAL 24-14 | 0 | 0 | 0 |
| Thu, Nov 27 | atDALW 33-10 | 0 | 0 | 0 |
| Sun, Nov 23 | vs TENW 43-24 | 0 | 0 | 0 |
| Sun, Nov 16 | at GBL 53-20 | 0 | 0 | 0 |
What were Brad Smith's career stats?
Brad Smith played 9 seasons for the Jets, the Bills and the Eagles. He had 104 receptions for 987 yards and 5 receiving touchdowns. His best season was 2010: 299 rushing yards, 1 rushing touchdown and 7.9 yards per carry.
Brad Smith college stats
Brad Smith played 2 seasons at Missouri Tigers (2004 to 2005): 3 catches for 41 yards and 0 touchdowns.
passing
rushing
receiving
scoring
College seasons as ESPN files them for the school he played for.
More on Brad Smith
Playoff games
Brad Smith played 8 games across 4 NFL postseasons — 4 won, 4 lost.
| CAR: Times the player ran with the ball. | YDS: Yards gained through the air, on the ground or after a catch, whichever this table counts. | TD: Touchdowns, worth six points before the extra point. | |||
|---|---|---|---|---|---|
| 2013 |  NO | L 26-24 | 0 | 0 | 0 |
| 2010 |  IND | W 17-16 | 2 | 0 | 0 |
| 2010 |  NE | W 28-21 | 0 | 0 | 0 |
| 2010 |  PIT | L 24-19 | 0 | 25 | 0 |
| 2009 |  CIN | W 24-14 | 2 | 1 | 0 |
| 2009 |  LAC | W 17-14 | 0 | 0 | 0 |
| 2009 | IND | L 30-17 | 0 | 7 | 0 |
| 2006 | NE | L 37-16 | 0 | 8 | 0 |
What the columns mean: CAR
Totals, from NFL game logs since the 1994 postseason — earlier games are not counted.
Brad Smith against each club
- vs New England Patriots (15)
- vs Miami Dolphins (13)
- vs Buffalo Bills (8)
- vs Tennessee Titans (7)
- vs Cincinnati Bengals (6)
- vs Dallas Cowboys (5)
- vs Indianapolis Colts (5)
- vs Cleveland Browns (4)
- vs Houston Texans (4)
- vs Jacksonville Jaguars (4)
- vs Kansas City Chiefs (4)
- vs Washington Commanders (4)
- vs Arizona Cardinals (3)
- vs Chicago Bears (3)
- vs Denver Broncos (3)
- vs Detroit Lions (3)
- vs Green Bay Packers (3)
- vs Las Vegas Raiders (3)
- vs Los Angeles Chargers (3)
- vs Los Angeles Rams (3)
- vs Minnesota Vikings (3)
- vs New York Giants (3)
- vs New York Jets (3)
- vs Pittsburgh Steelers (3)
- vs San Francisco 49ers (3)
- vs Seattle Seahawks (3)
- vs Baltimore Ravens (2)
- vs New Orleans Saints (2)
- vs Philadelphia Eagles (2)
- vs Atlanta Falcons (1)
- vs Carolina Panthers (1)
- vs Tampa Bay Buccaneers (1)
Similar players
Closest career per-game profiles to Brad Smith among NFL players at the same position.
- Joshua CribbsAlike in Yards per catch, Receptions95out of 100 on profile similarity
- Junior HemingwayAlike in Receptions, Receiving Yards91out of 100 on profile similarity
- Aaron MooreheadAlike in Receptions, Receiving Yards90out of 100 on profile similarity
- Micheal SpurlockAlike in Targets, Receptions88out of 100 on profile similarity
- Chad HallAlike in Targets, Receiving Yards86out of 100 on profile similarity


Compare Brad Smith with Joshua Cribbs, Junior Hemingway, Aaron Moorehead