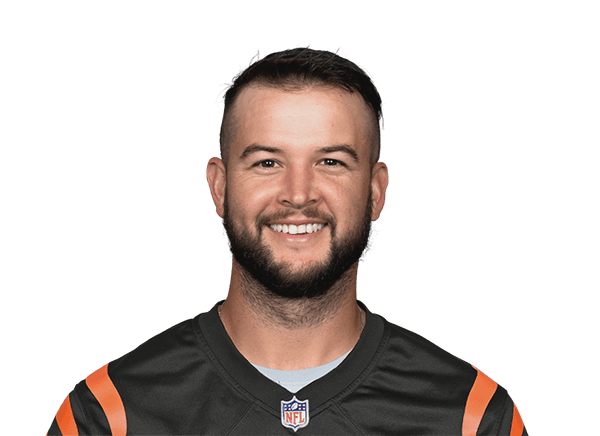
AJ McCarron stats
Bio
- Age
- 36 yearsSep 13, 1990
- Height
- 6' 3"
AJ McCarron played 7 NFL seasons, 2015 to 2023.
Stats
Totals
Career regular season
- GP
- 18
- CMP
- 113
- ATT
- 179
- CMP%
- 63.1
- YDS
- 1,192
- AVG
- 6.7
- TD
- 6
- INT
- 3
Ranked among NFL players who qualify (CMP, YDS, TD: 4+ games, 100+ ATT; CMP%, AVG: 4+ games, 200+ ATT) that season; only the top 50 are shown. How each stat qualifies: glossary.
Career Postseason
- GP
- 1
- CMP
- 23
- ATT
- 41
- CMP%
- 56.1
- YDS
- 212
- AVG
- 5.2
- TD
- 1
- INT
- 1
Per game
Career regular season
- GP
- 18
- CMP
- 6.3
- ATT
- 9.9
- CMP%
- 63.1
- YDS
- 66.2
- AVG
- 6.7
- TD
- 0.3
- INT
- 0.2
Per game: season totals ÷ games played. Derived here — averages, completion rate and longest plays are the stored figures and are left as they are.
Bio
- Age
- 36 yearsSep 13, 1990
- Height
- 6' 3"
- Debut
- 2014
- Birthplace
- Mobile, AL
- Draft
- 2014Rd 5, Pk 164
- College
- Alabama
Latest performance

AJ McCarron
Jan 07 · vs CLE · W 31-14
- CMP
- 3
- ATT
- 4
- YDS
- 20
- TD
- 0
- INT
- 0
- RTG
- 85.4
His top receivers, 2023
Cincinnati Bengals's pass catchers by receiving yards.
| Player | TGTS | REC | YDS | TD |
|---|---|---|---|---|
| Ja'Marr ChaseWR | 145 | 100 | 1,216 | 7 |
| Tyler BoydWR | 98 | 67 | 667 | 2 |
| Tee HigginsWR | 76 | 42 | 656 | 5 |
| Joe MixonRB | 64 | 52 | 376 | 3 |
| Tanner HudsonTE | 50 | 39 | 352 | 1 |
2014 NFL combine
QB, 6'3", 220 lb · Alabama
| Measure | Result | Percentile |
|---|---|---|
| 40-yard dash | 4.94s | 21st |
| Vertical jump | 28" | 13th |
| Broad jump | 8' 3" | 2nd |
| 3-cone drill | 7.18s | 40th |
| 20-yard shuttle | 4.34s | 48th |
Percentile: the share of QBs measured at the combine since 2000 he beat. The 2014 combine
Games
All games| Date | Opponent | CMP | ATT | YDS | TD | INT |
|---|---|---|---|---|---|---|
| Sun, Jan 07 | vs CLEW 31-14 | 3 | 4 | 20 | 0 | 0 |
| Sun, Dec 10 | vs INDW 34-14 | 1 | 1 | -1 | 0 | 0 |
| Sun, Jan 03 | vs TENL 41-38 | 1 | 1 | 20 | 0 | 0 |
| Sun, Dec 13 | at CHIL 36-7 | 0 | 0 | 0 | 0 | 0 |
| Sun, Jan 12 | at KCL 51-31 | 0 | 0 | 0 | 0 | 0 |
| Sat, Jan 04 | vs BUFW 22-19 OT | 0 | 0 | 0 | 0 | 0 |
What were AJ McCarron's career stats?
AJ McCarron played 7 seasons for the Bengals, the Raiders and the Texans. He completed 113 of 179 passes for 1,192 yards, 6 touchdowns and 3 interceptions. His best season was 2015: 854 passing yards, 6 passing touchdowns and 2 interceptions thrown.
Best single games
- Passing Yards: 280 vs PIT on Dec 13, 2015, L 33-20
- Passing Touchdowns: 2 vs BAL on Jan 3, 2016, W 24-16
- Rushing Yards: 39 vs TEN on Dec 29, 2019, L 35-14
- Rushing Touchdowns: 1 vs TEN on Dec 29, 2019, L 35-14
- Sacks: 4 @ SF on Dec 20, 2015, W 24-14
Regular season only, from NFL game logs since 2015.
AJ McCarron college stats
AJ McCarron played 4 seasons at Alabama Crimson Tide (2010 to 2013): 9,019 passing yards, 77 touchdown passes and 15 interceptions.
passing
rushing
defensive
scoring
College seasons as ESPN files them for the school he played for.
More on AJ McCarron
Playoff games
AJ McCarron played 4 games across 3 NFL postseasons — 1 won, 3 lost.
| YDS: Yards gained through the air, on the ground or after a catch, whichever this table counts. | TD: Touchdowns, worth six points before the extra point. | INT: Interceptions — thrown away by a quarterback, taken by a defender. | |||
|---|---|---|---|---|---|
| null | IND | L 26-10 | 0 | 0 | 0 |
| 2019 | BUF | W 22-19 OT | 0 | 0 | 0 |
| 2019 | KC | L 51-31 | 0 | 0 | 0 |
| 2015 |  PIT | L 18-16 | 212 | 1 | 1 |
What the columns mean: INT
Totals, from NFL game logs since the 1994 postseason — earlier games are not counted.
AJ McCarron against each club
- vs Cleveland Browns (4)
- vs Baltimore Ravens (3)
- vs Chicago Bears (2)
- vs Indianapolis Colts (2)
- vs Pittsburgh Steelers (2)
- vs San Francisco 49ers (2)
- vs Tennessee Titans (2)
- vs Buffalo Bills (1)
- vs Denver Broncos (1)
- vs Kansas City Chiefs (1)
- vs Los Angeles Rams (1)
- vs Minnesota Vikings (1)
- vs New England Patriots (1)
Similar players
Closest career per-game profiles to AJ McCarron among NFL players at the same position.
- Josh JohnsonCINAlike in Completion %53out of 100 on profile similarity
- Cooper RushAlike in Completion %49out of 100 on profile similarity
- Malik WillisMIAAlike in Completion %, Interceptions Thrown48out of 100 on profile similarity
- C.J. BeathardAlike in Yards per attempt, Completion %45out of 100 on profile similarity
- Tyrod TaylorGBAlike in Completion %, Yards per attempt41out of 100 on profile similarity


Compare AJ McCarron with Josh Johnson, Cooper Rush, Malik Willis