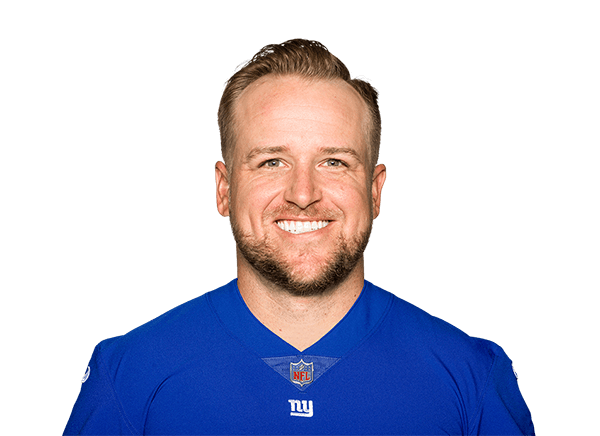
Matt Barkley stats
Bio
- Age
- 36 yearsSep 8, 1990
- Height
- 6' 2"
Matt Barkley played 7 NFL seasons, 2013 to 2023.
Stats
Totals
Career regular season
- GP
- 20
- CMP
- 212
- ATT
- 363
- CMP%
- 58.4
- YDS
- 2,699
- AVG
- 7.4
- TD
- 11
- INT
- 22
Ranked among NFL players who qualify (CMP, YDS, TD: 4+ games, 100+ ATT; CMP%, AVG: 4+ games, 200+ ATT) that season; only the top 50 are shown. How each stat qualifies: glossary.
Career Postseason
- GP
- 6
Per game
Career regular season
- GP
- 20
- CMP
- 10.6
- ATT
- 18.2
- CMP%
- 58.4
- YDS
- 134.9
- AVG
- 7.4
- TD
- 0.6
- INT
- 1.1
Per game: season totals ÷ games played. Derived here — averages, completion rate and longest plays are the stored figures and are left as they are.
Bio
- Age
- 36 yearsSep 8, 1990
- Height
- 6' 2"
- Debut
- 2013
- Birthplace
- Newport Beach, CA
- Draft
- 2013Rd 4, Pk 98
- College
- USC
Latest performance

Matt Barkley
Dec 31 · vs CAR · W 26-0
- CMP
- 0
- ATT
- 0
- YDS
- 0
- TD
- 0
- INT
- 0
- RTG
- 0.0
His top receivers, 2023
Jacksonville Jaguars's pass catchers by receiving yards.
| Player | TGTS | REC | YDS | TD |
|---|---|---|---|---|
| Calvin RidleyWR | 136 | 76 | 1,016 | 8 |
| Evan EngramTE | 143 | 114 | 963 | 4 |
| Christian KirkWR | 85 | 57 | 787 | 3 |
| Travis Etienne Jr.RB | 73 | 58 | 476 | 1 |
| Zay JonesWR | 64 | 34 | 321 | 2 |
2013 NFL combine
QB, 6'2", 227 lb · USC
| Measure | Result | Percentile |
|---|---|---|
| 40-yard dash | 4.91s | 26th |
Percentile: the share of QBs measured at the combine since 2000 he beat. The 2013 combine
Games
All games| Date | Opponent | CMP | ATT | YDS | TD | INT |
|---|---|---|---|---|---|---|
| Sun, Dec 31 | vs CARW 26-0 | 0 | 0 | 0 | 0 | 0 |
| Sat, Jan 16 | vs BALW 17-3 | 0 | 0 | 0 | 0 | 0 |
| Sun, Jan 03 | vs MIAW 56-26 | 6 | 13 | 164 | 1 | 1 |
| Mon, Dec 28 | at NEW 38-9 | 2 | 3 | 11 | 0 | 0 |
| Sat, Dec 19 | at DENW 48-19 | 0 | 0 | 0 | 0 | 0 |
| Sun, Nov 29 | vs LACW 27-17 | 0 | 0 | 0 | 0 | 0 |
What were Matt Barkley's career stats?
Matt Barkley played 7 seasons for the Eagles, the Bears, the Bills and the Jaguars. He completed 212 of 363 passes for 2,699 yards, 11 touchdowns and 22 interceptions. His best season was 2016: 1,611 passing yards, 8 passing touchdowns and 14 interceptions thrown.
League leaderboards and awards
7 seasons, 3 postseasons, 2013 to 2023
All-time career rank
- 280th in passing yards (2,699)
Among the 2,852 NFL players with a career line on file, regular season. A place deeper than 300th is not listed.
Matt Barkley college stats
Matt Barkley played 4 seasons at USC Trojans (2009 to 2012): 12,327 passing yards, 116 touchdown passes and 48 interceptions.
passing
rushing
defensive
scoring
College seasons as ESPN files them for the school he played for.
More on Matt Barkley
Playoff games
Matt Barkley played 5 games across 4 NFL postseasons — 2 won, 3 lost.
| YDS: Yards gained through the air, on the ground or after a catch, whichever this table counts. | TD: Touchdowns, worth six points before the extra point. | INT: Interceptions — thrown away by a quarterback, taken by a defender. | |||
|---|---|---|---|---|---|
| null |  GB | W 26-20 OT | 0 | 0 | 0 |
| null | CAR | L 49-15 | 0 | 0 | 0 |
| 2020 | BAL | W 17-3 | 0 | 0 | 0 |
| 2019 |  HOU | L 22-19 OT | 0 | 0 | 0 |
| 2013 |  NO | L 26-24 | 0 | 0 | 0 |
What the columns mean: INT
Totals, from NFL game logs since the 1994 postseason — earlier games are not counted.
Matt Barkley against each club
- vs Carolina Panthers (3)
- vs Green Bay Packers (3)
- vs New England Patriots (2)
- vs New York Jets (2)
- vs Tennessee Titans (2)
- vs Baltimore Ravens (1)
- vs Dallas Cowboys (1)
- vs Denver Broncos (1)
- vs Detroit Lions (1)
- vs Houston Texans (1)
- vs Las Vegas Raiders (1)
- vs Los Angeles Chargers (1)
- vs Miami Dolphins (1)
- vs Minnesota Vikings (1)
- vs New Orleans Saints (1)
- vs New York Giants (1)
- vs San Francisco 49ers (1)
- vs Washington Commanders (1)
Similar players
Closest career per-game profiles to Matt Barkley among NFL players at the same position.
- Derek AndersonAlike in Completion %, Passing Yards52out of 100 on profile similarity
- Jake LockerAlike in Yards per attempt, Passing Yards45out of 100 on profile similarity
- Blaine GabbertAlike in Passing Yards, Passing Touchdowns45out of 100 on profile similarity
- Mike VickAlike in Yards per attempt, Passing Yards43out of 100 on profile similarity
- Chad HenneAlike in Passing Touchdowns, Passing Yards42out of 100 on profile similarity


Compare Matt Barkley with Derek Anderson, Jake Locker, Blaine Gabbert