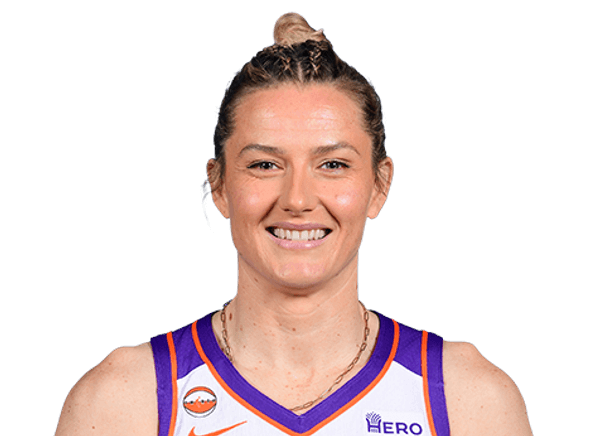
Sami Whitcomb stats
MercuryBio
- Age
- 38 yearsJul 20, 1988
- Height
- 5' 10"
- Weight
- 149 lbs

Sami Whitcomb averaged 5.3 points, 1.7 rebounds and 2.1 assists per game in 21 games of 2026 for the Phoenix Mercury. Last game: .
Stats
Per game
- PTS
- 5.3
- REB
- 1.7
- AST
- 2.1
- STL
- 0.6
- BLK
- 0.1
- TS%
- 46.8
- MIN
- 17.4
- GP
- 21
| PTS: Points scored — a free throw is worth 1, a shot inside the arc 2, beyond it 3. | REB: Missed shots the player collected, at either end of the floor. | AST: Passes that led directly to a team-mate's basket. | STL: Possessions taken off the opponent by picking off a pass or a dribble. | BLK: Opponent shots swatted away before they reached the rim. | TS%: Scoring per shot with threes and free throws counted: PTS ÷ (2 × (FGA + 0.44 × FTA)). League average sits near 58%. | MIN: Minutes on the floor. | GP: Games the player appeared in, however briefly. | ||
|---|---|---|---|---|---|---|---|---|---|
| 2017 |  SEA | 4.5 | 1.7 | 1.0 | 0.7 | 0.0 | 51.7 | 12.2 | 33 |
| 2018 | SEA | 2.9 | 0.9 | 0.5 | 0.5 | 0.1 | 51.3 | 8.5 | 31 |
| 2019 | SEA | 7.2 | 1.7 | 2.4 | 1.1 | 0.1 | 52.2 | 20.4 | 33 |
| 2020 | SEA | 8.1 | 2.3 | 2.0 | 0.7 | 0.1 | 59.5 | 16.5 | 22 |
| 2021 |  NY | 11.7 | 5.0 | 2.7 | 1.0 | 0.3 | 63.5 | 28.1 | 30 |
| 2022 | NY | 6.5 | 2.3 | 2.3 | 0.7 | 0.1 | 53.8 | 21.3 | 35 |
| 2023 | SEA | 9.7 | 2.9 | 2.9 | 0.9 | 0.4 | 56.7 | 24.5 | 40 |
| 2024 | SEA | 5.0 | 1.9 | 1.6 | 0.8 | 0.2 | 47.0 | 15.3 | 40 |
| 2025 | PHX | 9.1 | 2.6 | 2.5 | 0.8 | 0.2 | 54.4 | 23.9 | 43 |
| 2026 | PHX | 5.3 | 1.7 | 2.1 | 0.6 | 0.1 | 46.8 | 17.4 | 21 |
Career regular season
- PTS
- 7.1
- REB
- 2.3
- AST
- 2.0
- STL
- 0.8
- BLK
- 0.2
- TS%
- 54.5
- MIN
- 19.1
- GP
- 328
Career Postseason
- PTS
- 5.1
- REB
- 1.5
- AST
- 1.8
- STL
- 0.9
- BLK
- 0.1
- TS%
- 43.9
- MIN
- 17
- GP
- 28
Totals
- PTS
- 112
- REB
- 36
- AST
- 45
- STL
- 13
- BLK
- 2
- TO
- 24
- FGM
- 35
- 3PTM
- 27
| PTS: Points scored — a free throw is worth 1, a shot inside the arc 2, beyond it 3. | REB: Missed shots the player collected, at either end of the floor. | AST: Passes that led directly to a team-mate's basket. | STL: Possessions taken off the opponent by picking off a pass or a dribble. | BLK: Opponent shots swatted away before they reached the rim. | TO: Possessions handed to the opponent by a bad pass, a lost dribble or an offensive foul — lower is better. | FGM: Shots made from the floor — everything except free throws. | 3PTM: Three-point shots made. | ||
|---|---|---|---|---|---|---|---|---|---|
| 2017 | SEA | 147 | 56 | 34 | 24 | 0 | 29 | 48 | 34 |
| 2018 | SEA | 91 | 29 | 16 | 16 | 4 | 15 | 30 | 25 |
| 2019 | SEA | 238 | 57 | 79 | 36 | 4 | 52 | 82 | 63 |
| 2020 | SEA | 178 | 50 | 44 | 16 | 3 | 22 | 62 | 32 |
| 2021 | NY | 351 | 151 | 81 | 31 | 10 | 62 | 124 | 76 |
| 2022 | NY | 227 | 82 | 82 | 25 | 5 | 49 | 74 | 59 |
| 2023 | SEA | 389 | 114 | 115 | 35 | 14 | 80 | 128 | 89 |
| 2024 | SEA | 200 | 74 | 64 | 30 | 9 | 40 | 72 | 47 |
| 2025 | PHX | 390 | 113 | 108 | 33 | 7 | 67 | 129 | 86 |
| 2026 | PHX | 112 | 36 | 45 | 13 | 2 | 24 | 35 | 27 |
Career regular season
- PTS
- 2,323
- REB
- 762
- AST
- 668
- STL
- 259
- BLK
- 58
- TO
- 440
- FGM
- 784
- 3PTM
- 538
Per 36 min
- PTS
- 11.0
- REB
- 3.5
- AST
- 4.3
- STL
- 1.2
- BLK
- 0.2
- TS%
- 46.8
- MIN
- 17.4
- GP
- 21
Per 36 minutes: each per-game figure scaled by 36 ÷ minutes played. Derived here, and shooting percentages are left untouched because they do not scale.
| PTS: Points scored — a free throw is worth 1, a shot inside the arc 2, beyond it 3. | REB: Missed shots the player collected, at either end of the floor. | AST: Passes that led directly to a team-mate's basket. | STL: Possessions taken off the opponent by picking off a pass or a dribble. | BLK: Opponent shots swatted away before they reached the rim. | TS%: Scoring per shot with threes and free throws counted: PTS ÷ (2 × (FGA + 0.44 × FTA)). League average sits near 58%. | MIN: Minutes on the floor. | GP: Games the player appeared in, however briefly. | ||
|---|---|---|---|---|---|---|---|---|---|
| 2017 | SEA | 13.3 | 5.0 | 3.0 | 2.1 | 0.0 | 51.7 | 12.2 | 33 |
| 2018 | SEA | 12.3 | 3.8 | 2.1 | 2.1 | 0.4 | 51.3 | 8.5 | 31 |
| 2019 | SEA | 12.7 | 3.0 | 4.2 | 1.9 | 0.2 | 52.2 | 20.4 | 33 |
| 2020 | SEA | 17.7 | 5.0 | 4.4 | 1.5 | 0.2 | 59.5 | 16.5 | 22 |
| 2021 | NY | 15.0 | 6.4 | 3.5 | 1.3 | 0.4 | 63.5 | 28.1 | 30 |
| 2022 | NY | 11.0 | 3.9 | 3.9 | 1.2 | 0.2 | 53.8 | 21.3 | 35 |
| 2023 | SEA | 14.3 | 4.3 | 4.3 | 1.3 | 0.6 | 56.7 | 24.5 | 40 |
| 2024 | SEA | 11.8 | 4.5 | 3.8 | 1.9 | 0.5 | 47.0 | 15.3 | 40 |
| 2025 | PHX | 13.7 | 3.9 | 3.8 | 1.2 | 0.3 | 54.4 | 23.9 | 43 |
| 2026 | PHX | 11.0 | 3.5 | 4.3 | 1.2 | 0.2 | 46.8 | 17.4 | 21 |
Career regular season, Per 36 min
- PTS
- 13.4
- REB
- 4.3
- AST
- 3.8
- STL
- 1.5
- BLK
- 0.4
- TS%
- 54.5
- MIN
- 19.1
- GP
- 328
Bio
- Age
- 38 yearsJul 20, 1988
- Height
- 5' 10"
- Weight
- 149 lbs
- Experience
- 10 years
- Birthplace
- Ventura, CA
- College
- Washington
Latest performance

Sami Whitcomb
Sep 24 · vs LV · L 100-82
- MIN
- 19
- PTS
- 3
- REB
- 2
- AST
- 1
- STL
- 1
- BLK
- 0
- FG%
- 20.0
- 3PTM
- 1
Games
All games| Date | Opponent | PTS | REB | AST | MIN |
|---|---|---|---|---|---|
| Thu, Sep 24 | vs LVL 100-82 | 3 | 2 | 1 | 19 |
| Mon, Sep 21 | vs DALW 87-86 | 8 | 2 | 2 | 15 |
| Sat, Sep 19 | atDALL 87-82 | 4 | 1 | 4 | 25 |
| Thu, Sep 17 | at PORW 94-91 | 11 | 2 | 4 | 26 |
| Sat, Aug 29 | vs TORW 101-69 | 14 | 3 | 2 | 16 |
| Thu, Aug 27 | vs WSHL 80-73 | 3 | 0 | 0 | 19 |
What are Sami Whitcomb's career stats?
Sami Whitcomb has played 10 seasons for the Storm, the Liberty and the Mercury. She has scored 2,323 points with 762 rebounds and 668 assists in 328 games — 7.1 points, 2.3 rebounds and 2.0 assists per game. Her best season so far is 2025: 390 points, 113 rebounds and 108 assists.
Milestones within reach
- 12 more 3-pointers for 550 — 538 now, 86 in her best season of the last two
League leaderboards and awards
10 seasons, 8 postseasons, 2017 to 2026
Championships ×2
- 2018 WNBA Finals with the Seattle Storm
- 2020 WNBA Finals with the Seattle Storm
All-time career rank
- 135th in points (2,323)
- 188th in rebounds (762)
- 94th in assists (668)
- 16th in 3-pointers made (538)
- 122nd in steals (259)
- 210th in blocks (58)
Among the 968 WNBA players with a career line on file, regular season. A place deeper than 300th is not listed.
Sami Whitcomb college stats
Sami Whitcomb played one season at Washington Huskies (2009-10): 11.1 points, 5.7 rebounds and 2.4 assists a game over 9 games.
Per game
Totals
More
College seasons as ESPN files them for the school she played for.
More on Sami Whitcomb
Playoff series
Sami Whitcomb played 28 games across 8 WNBA postseasons in 12 series — 5 won, 7 lost.
| PTS: Points scored — a free throw is worth 1, a shot inside the arc 2, beyond it 3. | REB: Missed shots the player collected, at either end of the floor. | AST: Passes that led directly to a team-mate's basket. | ||||
|---|---|---|---|---|---|---|
| 2025 | NY | Won 2-1 | 3 | 7.3 | 2.0 | 2.3 |
| 2025 |  MIN | Won 3-1 | 4 | 8.5 | 3.0 | 3.8 |
| 2025 | LV | Lost 0-4 | 4 | 2.3 | 0.8 | 1.5 |
| 2024 | LV | Lost 0-1 | 1 | 0.0 | 0.0 | 0.0 |
| 2022 |  CHI | Lost 1-2 | 3 | 3.7 | 0.3 | 2.0 |
| 2021 |  PHX | Lost 0-1 | 1 | 3.0 | 5.0 | 2.0 |
| 2020 | MIN | Won 3-0 | 3 | 5.0 | 1.3 | 1.7 |
| 2019 | MIN | Won 1-0 | 1 | 6.0 | 0.0 | 0.0 |
| 2019 |  LA | Lost 0-1 | 1 | 3.0 | 1.0 | 0.0 |
| 2018 | PHX | Lost 1-2 | 3 | 6.3 | 1.3 | 1.7 |
| 2018 | WSH | Won 3-0 | 3 | 6.0 | 1.0 | 0.7 |
| 2017 | PHX | Lost 0-1 | 1 | 3.0 | 2.0 | 1.0 |
Sami Whitcomb’s playoff series, round by round
Per game, from WNBA game logs since the 1999 postseason — earlier series are not counted.
Sami Whitcomb against each club
- vs Minnesota Lynx (39)
- vs Las Vegas Aces (37)
- vs Chicago Sky (34)
- vs Dallas Wings (32)
- vs Washington Mystics (32)
- vs Los Angeles Sparks (30)
- vs Connecticut Sun (28)
- vs Atlanta Dream (27)
- vs Indiana Fever (27)
- vs Phoenix Mercury (27)
- vs New York Liberty (26)
- vs Seattle Storm (10)
- vs Golden State Valkyries (5)
- vs Portland Fire (2)
- vs Toronto Tempo (1)
Similar players
Closest career per-game profiles to Sami Whitcomb among WNBA players at the same position.
- Leilani MitchellAlike in Steals, Points66out of 100 on profile similarity
- Marine JohannesNYAlike in 3-Pointers Made63out of 100 on profile similarity
- Kia NurseTORAlike in 3-Pointers Made60out of 100 on profile similarity
- Sugar RodgersAlike in Points, Rebounds59out of 100 on profile similarity
- Sophie CunninghamINDAlike in 3-Pointers Made58out of 100 on profile similarity


Compare Sami Whitcomb with Leilani Mitchell, Marine Johannes, Kia Nurse