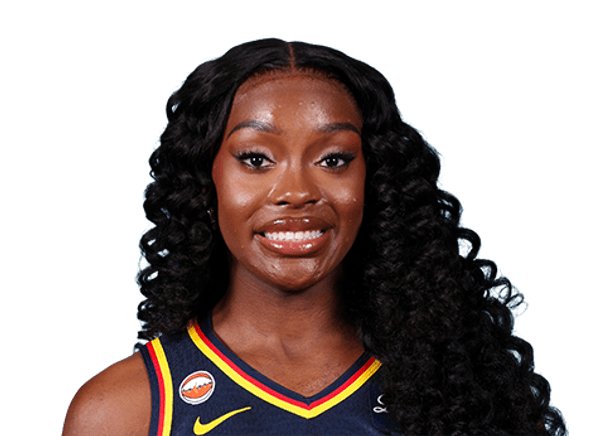
Raven Johnson stats
FeverBio
- Age
- 23 yearsMar 4, 2003
- Height
- 5' 8"

Raven Johnson averaged 3.1 points, 1.7 rebounds and 1.2 assists per game in 39 games of 2026 for the Indiana Fever. Last game: .
Stats
Per game
 Fever
- PTS
- 3.1
- REB
- 1.7
- AST
- 1.2
- STL
- 0.4
- BLK
- 0.2
- TS%
- 46.7
- MIN
- 10.9
- GP
- 39
Career regular season
- PTS
- 3.1
- REB
- 1.7
- AST
- 1.2
- STL
- 0.4
- BLK
- 0.2
- TS%
- 46.7
- MIN
- 10.9
- GP
- 39
Career Postseason
- PTS
- 7.3
- REB
- 2.0
- AST
- 0.3
- STL
- 1.0
- BLK
- 0.3
- TS%
- 63.1
- MIN
- 20.7
- GP
- 3
Totals
- PTS
- 122
- REB
- 67
- AST
- 47
- STL
- 16
- BLK
- 6
- TO
- 28
- FGM
- 51
- 3PTM
- 11
Career regular season
- PTS
- 122
- REB
- 67
- AST
- 47
- STL
- 16
- BLK
- 6
- TO
- 28
- FGM
- 51
- 3PTM
- 11
Per 36 min
- PTS
- 10.2
- REB
- 5.6
- AST
- 4.0
- STL
- 1.3
- BLK
- 0.7
- TS%
- 46.7
- MIN
- 10.9
- GP
- 39
Per 36 minutes: each per-game figure scaled by 36 ÷ minutes played. Derived here, and shooting percentages are left untouched because they do not scale.
Career regular season, Per 36 min
- PTS
- 10.2
- REB
- 5.6
- AST
- 4.0
- STL
- 1.3
- BLK
- 0.7
- TS%
- 46.7
- MIN
- 10.9
- GP
- 39
Bio
- Age
- 23 yearsMar 4, 2003
- Height
- 5' 8"
- Experience
- 0 years
- Birthplace
- Atlanta, GA
- Draft
- 2026Rd 1, Pk 10
- College
- South Carolina
Latest performance

Raven Johnson
Oct 01 · @ LV · L 94-83
- MIN
- 19
- PTS
- 2
- REB
- 4
- AST
- 0
- STL
- 0
- BLK
- 0
- FG%
- 20.0
- 3PTM
- 0
Games
All games| Date | Opponent | PTS | REB | AST | MIN |
|---|---|---|---|---|---|
| Thu, Oct 01 | at LVL 94-83 | 2 | 4 | 0 | 19 |
| Tue, Sep 29 | vsLVW 99-89 | 6 | 2 | 0 | 22 |
| Sun, Sep 27 | atLVL 102-85 | 14 | 0 | 1 | 22 |
| Thu, Sep 24 | at MINL 86-66 | 6 | 3 | 4 | 23 |
| Tue, Sep 22 | vsMINW 96-77 | 2 | 1 | 1 | 8 |
| Sun, Sep 20 | vs WSHL 93-77 | 6 | 4 | 0 | 26 |
What are Raven Johnson's career stats?
Raven Johnson has played 1 season for the Fever. She has scored 122 points with 67 rebounds and 47 assists in 39 games — 3.1 points, 1.7 rebounds and 1.2 assists per game. Her best season so far is 2026: 122 points, 67 rebounds and 47 assists.
Raven Johnson college stats
Raven Johnson played 5 seasons at South Carolina Gamecocks (2021-22 to 2025-26): 6.7 points, 4.0 rebounds and 4.0 assists a game over 154 games.
Per game
Totals
More
College seasons as ESPN files them for the school she played for.
More on Raven Johnson
Playoff series
Raven Johnson played 3 games across 1 WNBA postseason in one series — 0 won, 1 lost.
| Season | Opp | Series | G | PTSPTS: Points scored — a free throw is worth 1, a shot inside the arc 2, beyond it 3. | REBREB: Missed shots the player collected, at either end of the floor. | ASTAST: Passes that led directly to a team-mate's basket. |
|---|---|---|---|---|---|---|
| 2026 | LV | Lost 1-2 | 3 | 7.3 | 2.0 | 0.3 |
Per game, from WNBA game logs since the 1999 postseason — earlier series are not counted.
Raven Johnson against each club
- vs Las Vegas Aces (5)
- vs Atlanta Dream (4)
- vs New York Liberty (4)
- vs Chicago Sky (3)
- vs Dallas Wings (3)
- vs Golden State Valkyries (3)
- vs Los Angeles Sparks (3)
- vs Minnesota Lynx (3)
- vs Phoenix Mercury (3)
- vs Portland Fire (3)
- vs Toronto Tempo (3)
- vs Washington Mystics (3)
- vs Connecticut Sun (2)
- vs Seattle Storm (2)
Similar players
Closest career per-game profiles to Raven Johnson among WNBA players at the same position.
- Maya CaldwellMINAlike in Assists, Blocks60out of 100 on profile similarity
- Shatori Walker-KimbroughATLAlike in Assists, Rebounds55out of 100 on profile similarity
- Jade MelbourneSEAAlike in Rebounds, Field Goal %52out of 100 on profile similarity
- Karlie SamuelsonPORAlike in Assists, Rebounds51out of 100 on profile similarity
- Haley JonesDALAlike in 3-Pointers Made, Field Goal %49out of 100 on profile similarity


Compare Raven Johnson with Maya Caldwell, Shatori Walker-Kimbrough, Jade Melbourne