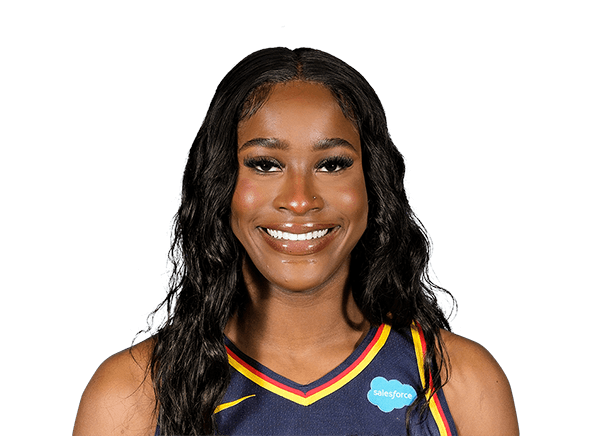
Queen Egbo stats
Bio
- Age
- 26 yearsJun 29, 2000
- Height
- 6' 4"
Queen Egbo played 3 WNBA seasons, 2022 to 2024.
Stats
Per game
Career regular season
- PTS
- 5.5
- REB
- 4.8
- AST
- 0.5
- STL
- 0.6
- BLK
- 0.8
- TS%
- 49.9
- MIN
- 15.7
- GP
- 78
| PTS: Points scored — a free throw is worth 1, a shot inside the arc 2, beyond it 3. | REB: Missed shots the player collected, at either end of the floor. | AST: Passes that led directly to a team-mate's basket. | STL: Possessions taken off the opponent by picking off a pass or a dribble. | BLK: Opponent shots swatted away before they reached the rim. | TS%: Scoring per shot with threes and free throws counted: PTS ÷ (2 × (FGA + 0.44 × FTA)). League average sits near 58%. | MIN: Minutes on the floor. | GP: Games the player appeared in, however briefly. | ||
|---|---|---|---|---|---|---|---|---|---|
| 2022 |  IND | 7.2 | 6.3 | 0.9 | 0.9 | 1.2 | 48.1 | 21.8 | 33 |
| 2023 |  IND/WSH | 4.8 | 4.3 | 0.3 | 0.4 | 0.6 | 52.8 | 12.8 | 37 |
| 2024 |  CON/LA/LV | 1.5 | 1.3 | 0.0 | 0.4 | 0.1 | 46.6 | 3.6 | 8 |
Career Postseason
- PTS
- 0.0
- REB
- 0.7
- AST
- 0.3
- STL
- 0.0
- BLK
- 0.0
- TS%
- 0.0
- MIN
- 4
- GP
- 3
Totals
Career regular season
- PTS
- 429
- REB
- 377
- AST
- 42
- STL
- 48
- BLK
- 65
- TO
- 99
- FGM
- 174
- 3PTM
- 0
| PTS: Points scored — a free throw is worth 1, a shot inside the arc 2, beyond it 3. | REB: Missed shots the player collected, at either end of the floor. | AST: Passes that led directly to a team-mate's basket. | STL: Possessions taken off the opponent by picking off a pass or a dribble. | BLK: Opponent shots swatted away before they reached the rim. | TO: Possessions handed to the opponent by a bad pass, a lost dribble or an offensive foul — lower is better. | FGM: Shots made from the floor — everything except free throws. | 3PTM: Three-point shots made. | ||
|---|---|---|---|---|---|---|---|---|---|
| 2022 | IND | 239 | 209 | 31 | 30 | 40 | 64 | 95 | 0 |
| 2023 | IND/WSH | 178 | 158 | 11 | 15 | 24 | 35 | 74 | 0 |
| 2024 | CON/LA/LV | 12 | 10 | 0 | 3 | 1 | 0 | 5 | 0 |
Per 36 min
Career regular season
- PTS
- 12.6
- REB
- 11.0
- AST
- 1.1
- STL
- 1.4
- BLK
- 1.8
- TS%
- 49.9
- MIN
- 15.7
- GP
- 78
Per 36 minutes: each per-game figure scaled by 36 ÷ minutes played. Derived here, and shooting percentages are left untouched because they do not scale.
| PTS: Points scored — a free throw is worth 1, a shot inside the arc 2, beyond it 3. | REB: Missed shots the player collected, at either end of the floor. | AST: Passes that led directly to a team-mate's basket. | STL: Possessions taken off the opponent by picking off a pass or a dribble. | BLK: Opponent shots swatted away before they reached the rim. | TS%: Scoring per shot with threes and free throws counted: PTS ÷ (2 × (FGA + 0.44 × FTA)). League average sits near 58%. | MIN: Minutes on the floor. | GP: Games the player appeared in, however briefly. | ||
|---|---|---|---|---|---|---|---|---|---|
| 2022 | IND | 11.9 | 10.4 | 1.5 | 1.5 | 2.0 | 48.1 | 21.8 | 33 |
| 2023 | IND/WSH | 13.5 | 12.1 | 0.8 | 1.1 | 1.7 | 52.8 | 12.8 | 37 |
| 2024 | CON/LA/LV | 15.0 | 13.0 | 0.0 | 4.0 | 1.0 | 46.6 | 3.6 | 8 |
Bio
- Age
- 26 yearsJun 29, 2000
- Height
- 6' 4"
- Birthplace
- Houston, TX
- Draft
- 2022Rd 1, Pk 10
- College
- Baylor
Latest performance

Queen Egbo
Oct 04 · vs NY · W 95-81
- MIN
- 3
- PTS
- 0
- REB
- 1
- AST
- 1
- STL
- 0
- BLK
- 0
- FG%
- 0.0
- 3PTM
- 0
Games
All games| Date | Opponent | PTS | REB | AST | MIN |
|---|---|---|---|---|---|
| Fri, Oct 04 | vs NYW 95-81 | 0 | 1 | 1 | 3 |
| Thu, Sep 19 | vs DALW 98-84 | 8 | 5 | 0 | 15 |
| Sun, Sep 15 | vs CONW 84-71 | 0 | 0 | 0 | 1 |
| Sun, Sep 08 | atNYL 75-71 | 0 | 0 | 0 | 1 |
| Fri, Jun 28 | at PHXL 92-78 | 0 | 1 | 0 | 1 |
| Sat, Jun 22 | atNYL 98-88 | 2 | 2 | 0 | 3 |
What were Queen Egbo's career stats?
Queen Egbo played 3 seasons for the Fever. She scored 429 points with 377 rebounds and 42 assists in 78 games — 5.5 points, 4.8 rebounds and 0.5 assists per game. Her best season was 2022: 239 points, 209 rebounds and 31 assists.
League leaderboards and awards
3 seasons, 2 postseasons, 2022 to 2024
All-time career rank
- 197th in blocks (65)
Among the 968 WNBA players with a career line on file, regular season. A place deeper than 300th is not listed.
Queen Egbo college stats
Queen Egbo played 4 seasons at Baylor Bears (2018-19 to 2021-22): 9.5 points, 7.0 rebounds and 0.6 assists a game over 130 games.
Per game
Totals
More
College seasons as ESPN files them for the school she played for.
More on Queen Egbo
Playoff series
Queen Egbo played 3 games across 2 WNBA postseasons in 2 series — 1 won, 1 lost.
| PTS: Points scored — a free throw is worth 1, a shot inside the arc 2, beyond it 3. | REB: Missed shots the player collected, at either end of the floor. | AST: Passes that led directly to a team-mate's basket. | ||||
|---|---|---|---|---|---|---|
| 2024 | NY | Won 1-0 | 1 | 0.0 | 1.0 | 1.0 |
| 2023 | NY | Lost 0-2 | 2 | 0.0 | 0.5 | 0.0 |
Queen Egbo’s playoff series, round by round
Per game, from WNBA game logs since the 1999 postseason — earlier series are not counted.
Queen Egbo against each club
Similar players
Closest career per-game profiles to Queen Egbo among WNBA players at the same position.
- Kia VaughnAlike in 3-Pointers Made, Field Goal %71out of 100 on profile similarity
- Kiah StokesGSAlike in Field Goal %, Steals66out of 100 on profile similarity
- Olivia Nelson-OdodaAlike in 3-Pointers Made, Blocks64out of 100 on profile similarity
- Mercedes RussellINDAlike in 3-Pointers Made, Steals61out of 100 on profile similarity
- Temi FagbenleTORAlike in Points, Steals56out of 100 on profile similarity


Compare Queen Egbo with Kia Vaughn, Kiah Stokes, Olivia Nelson-Ododa