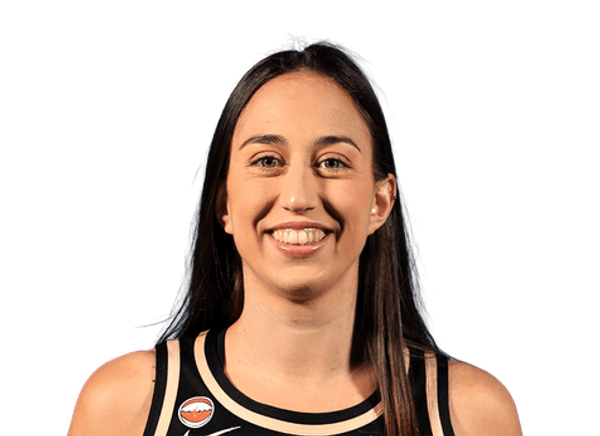
Maite Cazorla stats
Bio
- Age
- 29 yearsJun 18, 1997
- Height
- 5' 10"
Maite Cazorla played 1 WNBA season, 2019 to 2019.
Stats
Per game
Career regular season
- PTS
- 3.0
- REB
- 0.7
- AST
- 1.6
- STL
- 0.6
- BLK
- 0.0
- TS%
- 44.4
- MIN
- 15.4
- GP
- 31
| Season | Team | PTSPTS: Points scored — a free throw is worth 1, a shot inside the arc 2, beyond it 3. | REBREB: Missed shots the player collected, at either end of the floor. | ASTAST: Passes that led directly to a team-mate's basket. | STLSTL: Possessions taken off the opponent by picking off a pass or a dribble. | BLKBLK: Opponent shots swatted away before they reached the rim. | TS%TS%: Scoring per shot with threes and free throws counted: PTS ÷ (2 × (FGA + 0.44 × FTA)). League average sits near 58%. | MINMIN: Minutes on the floor. | GPGP: Games the player appeared in, however briefly. |
|---|---|---|---|---|---|---|---|---|---|
| 2019 |  ATL | 3.0 | 0.7 | 1.6 | 0.6 | 0.0 | 44.4 | 15.4 | 31 |
Totals
Career regular season
- PTS
- 92
- REB
- 21
- AST
- 49
- STL
- 18
- BLK
- 1
- TO
- 29
- FGM
- 29
- 3PTM
- 13
| Season | Team | PTSPTS: Points scored — a free throw is worth 1, a shot inside the arc 2, beyond it 3. | REBREB: Missed shots the player collected, at either end of the floor. | ASTAST: Passes that led directly to a team-mate's basket. | STLSTL: Possessions taken off the opponent by picking off a pass or a dribble. | BLKBLK: Opponent shots swatted away before they reached the rim. | TOTO: Possessions handed to the opponent by a bad pass, a lost dribble or an offensive foul — lower is better. | FGMFGM: Shots made from the floor — everything except free throws. | 3PTM3PTM: Three-point shots made. |
|---|---|---|---|---|---|---|---|---|---|
| 2019 | ATL | 92 | 21 | 49 | 18 | 1 | 29 | 29 | 13 |
Per 36 min
Career regular season
- PTS
- 7.0
- REB
- 1.6
- AST
- 3.7
- STL
- 1.4
- BLK
- 0.0
- TS%
- 44.4
- MIN
- 15.4
- GP
- 31
Per 36 minutes: each per-game figure scaled by 36 ÷ minutes played. Derived here, and shooting percentages are left untouched because they do not scale.
| Season | Team | PTSPTS: Points scored — a free throw is worth 1, a shot inside the arc 2, beyond it 3. | REBREB: Missed shots the player collected, at either end of the floor. | ASTAST: Passes that led directly to a team-mate's basket. | STLSTL: Possessions taken off the opponent by picking off a pass or a dribble. | BLKBLK: Opponent shots swatted away before they reached the rim. | TS%TS%: Scoring per shot with threes and free throws counted: PTS ÷ (2 × (FGA + 0.44 × FTA)). League average sits near 58%. | MINMIN: Minutes on the floor. | GPGP: Games the player appeared in, however briefly. |
|---|---|---|---|---|---|---|---|---|---|
| 2019 | ATL | 7.0 | 1.6 | 3.7 | 1.4 | 0.0 | 44.4 | 15.4 | 31 |
Bio
- Age
- 29 yearsJun 18, 1997
- Height
- 5' 10"
- Birthplace
- Las Palmas, Spain
- College
- Oregon
Latest performance

Maite Cazorla
Sep 08 · vs NY · L 71-63
- MIN
- 24
- PTS
- 2
- REB
- 1
- AST
- 3
- STL
- 2
- BLK
- 0
- FG%
- 14.3
- 3PTM
- 0
Games
All games| Date | Opponent | PTS | REB | AST | MIN |
|---|---|---|---|---|---|
| Sun, Sep 08 | vs NYL 71-63 | 2 | 1 | 3 | 24 |
| Thu, Sep 05 | vs LVW 78-74 | 0 | 1 | 1 | 21 |
| Tue, Sep 03 | at LAL 70-60 | 2 | 1 | 2 | 21 |
| Sun, Sep 01 | at SEAL 92-75 | 9 | 0 | 3 | 19 |
| Thu, Aug 29 | vs PHXL 65-58 | 2 | 1 | 0 | 13 |
| Sun, Aug 25 | at DALW 77-73 | 0 | 0 | 1 | 8 |
What were Maite Cazorla's career stats?
Maite Cazorla played 1 season for the Dream. She scored 92 points with 21 rebounds and 49 assists in 31 games — 3.0 points, 0.7 rebounds and 1.6 assists per game. Her best season was 2019: 92 points, 21 rebounds and 49 assists.
Maite Cazorla college stats
Maite Cazorla played 4 seasons at Oregon Ducks (2015-16 to 2018-19): 10.1 points, 1.9 rebounds and 4.7 assists a game over 146 games.
Per game
Totals
More
College seasons as ESPN files them for the school she played for.
More on Maite Cazorla
Maite Cazorla against each club
Similar players
Closest career per-game profiles to Maite Cazorla among WNBA players at the same position.
- Sydney WieseAlike in Points, Assists52out of 100 on profile similarity
- Sydney ColsonAlike in Steals, Rebounds45out of 100 on profile similarity
- Yvonne TurnerAlike in Steals, Assists43out of 100 on profile similarity
- Lexie BrownAlike in Assists, Blocks41out of 100 on profile similarity
- Rachel BanhamCHIAlike in Assists, Rebounds37out of 100 on profile similarity


Compare Maite Cazorla with Sydney Wiese, Sydney Colson, Yvonne Turner