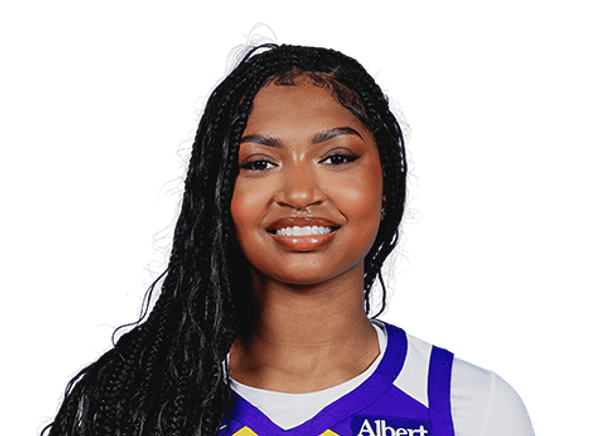
Chance Gray stats

Sparks

Guard · #2

Age 22 · 5' 9"

Compare with…

Chance Gray averaged 3.1 points, 1.1 rebounds and 1.0 assist per game in 40 games of 2026 for the Los Angeles Sparks. Last game: .

Stats

Choose how these numbers are shown

Per game

PTS
3.1
REB
1.1
AST
1.0
STL
0.2
BLK
0.0
TS%
55.3
MIN
11.5
GP
40
Per game by season
SeasonTeamPTSPTS: Points scored — a free throw is worth 1, a shot inside the arc 2, beyond it 3.REBREB: Missed shots the player collected, at either end of the floor.ASTAST: Passes that led directly to a team-mate's basket.STLSTL: Possessions taken off the opponent by picking off a pass or a dribble.BLKBLK: Opponent shots swatted away before they reached the rim.TS%TS%: Scoring per shot with threes and free throws counted: PTS ÷ (2 × (FGA + 0.44 × FTA)). League average sits near 58%.MINMIN: Minutes on the floor.GPGP: Games the player appeared in, however briefly.
2026LA3.11.11.00.20.055.311.540

Career regular season

PTS
3.1
REB
1.1
AST
1.0
STL
0.2
BLK
0.0
TS%
55.3
MIN
11.5
GP
40

Totals

PTS
124
REB
43
AST
41
STL
6
BLK
1
TO
25
FGM
38
3PTM
28
Totals by season
SeasonTeamPTSPTS: Points scored — a free throw is worth 1, a shot inside the arc 2, beyond it 3.REBREB: Missed shots the player collected, at either end of the floor.ASTAST: Passes that led directly to a team-mate's basket.STLSTL: Possessions taken off the opponent by picking off a pass or a dribble.BLKBLK: Opponent shots swatted away before they reached the rim.TOTO: Possessions handed to the opponent by a bad pass, a lost dribble or an offensive foul — lower is better.FGMFGM: Shots made from the floor — everything except free throws.3PTM3PTM: Three-point shots made.
2026LA124434161253828

Career regular season

PTS
124
REB
43
AST
41
STL
6
BLK
1
TO
25
FGM
38
3PTM
28

Per 36 min

PTS
9.7
REB
3.4
AST
3.1
STL
0.6
BLK
0.0
TS%
55.3
MIN
11.5
GP
40

Per 36 minutes: each per-game figure scaled by 36 ÷ minutes played. Derived here, and shooting percentages are left untouched because they do not scale.

Per 36 min by season
SeasonTeamPTSPTS: Points scored — a free throw is worth 1, a shot inside the arc 2, beyond it 3.REBREB: Missed shots the player collected, at either end of the floor.ASTAST: Passes that led directly to a team-mate's basket.STLSTL: Possessions taken off the opponent by picking off a pass or a dribble.BLKBLK: Opponent shots swatted away before they reached the rim.TS%TS%: Scoring per shot with threes and free throws counted: PTS ÷ (2 × (FGA + 0.44 × FTA)). League average sits near 58%.MINMIN: Minutes on the floor.GPGP: Games the player appeared in, however briefly.
2026LA9.73.43.10.60.055.311.540

Career regular season, Per 36 min

PTS
9.7
REB
3.4
AST
3.1
STL
0.6
BLK
0.0
TS%
55.3
MIN
11.5
GP
40

Bio

Age
22 yearsJul 6, 2004
Height
5' 9"
Experience
0 years
Birthplace
Cincinnati, OH
Draft
2026Rd 2, Pk 24
College
Ohio State

Latest performance

Chance Gray

Sep 24 · vs GS · L 76-75

MIN
9
PTS
3
REB
1
AST
1
STL
0
BLK
0
FG%
50.0
3PTM
1
Most recent games
DateOpponentPTSREBASTMIN
Thu, Sep 24vsGSL 76-753119
Tue, Sep 22atLVL 89-7910315
Sun, Sep 20vsPORW 105-84111017
Sun, Aug 30atSEAW 90-7460117
Fri, Aug 28vsWSHW 88-8200210
Mon, Aug 24vsATLL 78-7100121

What are Chance Gray's career stats?

Chance Gray has played 1 season for the Sparks. She has scored 124 points with 43 rebounds and 41 assists in 40 games — 3.1 points, 1.1 rebounds and 1.0 assists per game. Her best season so far is 2026: 124 points, 43 rebounds and 41 assists.

Chance Gray college stats

Chance Gray played 4 seasons at Oregon Ducks and Ohio State Buckeyes (2022-23 to 2025-26): 12.7 points, 2.3 rebounds and 2.3 assists a game over 134 games.

Per game

Chance Gray's college Per game by season
GP: Games the player appeared in, however briefly.GS: Games the player was in the starting five.MIN: Minutes on the floor.PTS: Points scored — a free throw is worth 1, a shot inside the arc 2, beyond it 3.REB: Missed shots the player collected, at either end of the floor.AST: Passes that led directly to a team-mate's basket.STL: Possessions taken off the opponent by picking off a pass or a dribble.BLK: Opponent shots swatted away before they reached the rim.TO: Possessions handed to the opponent by a bad pass, a lost dribble or an offensive foul — lower is better.FG%: Share of shots from the floor that went in. League average sits near 47%.3P%: Share of three-point attempts that went in. League average sits near 36%.FT%: Share of free throws that went in. League average sits near 78%.PF: Fouls committed. Six in one game and the player is disqualified — lower is better.OR: Rebounds grabbed at the offensive end, which hand the team a fresh possession.DR: Rebounds grabbed at the defensive end, which end the opponent's possession.
2022-23Oregon Ducks353530.210.32.12.20.70.11.63.6-10.534.21.6-4.833.11.6-1.887.310.51.7
2023-24Oregon Ducks313136.513.92.930.802.74.8-13.934.71.9-5.633.72.4-2.981.10.90.32.7
2024-25Ohio State Buckeyes333327.6121.81.51.40.11.24.2-10.439.82.1-6.134.81.6-1.984.11.30.31.5
2025-26Ohio State Buckeyes353532.114.72.52.70.901.85.2-11.545.32.4-6.040.51.8-2.088.60.80.32.1

Totals

Chance Gray's college Totals by season
PTS: Points scored — a free throw is worth 1, a shot inside the arc 2, beyond it 3.OR: Rebounds grabbed at the offensive end, which hand the team a fresh possession.DR: Rebounds grabbed at the defensive end, which end the opponent's possession.REB: Missed shots the player collected, at either end of the floor.AST: Passes that led directly to a team-mate's basket.STL: Possessions taken off the opponent by picking off a pass or a dribble.BLK: Opponent shots swatted away before they reached the rim.TO: Possessions handed to the opponent by a bad pass, a lost dribble or an offensive foul — lower is better.FG%: Share of shots from the floor that went in. League average sits near 47%.3P%: Share of three-point attempts that went in. League average sits near 36%.FT%: Share of free throws that went in. League average sits near 78%.PF: Fouls committed. Six in one game and the player is disqualified — lower is better.
2022-23Oregon Ducks3611758757726455125-36634.256-16933.155-6387.334
2023-24Oregon Ducks430883919224184149-43034.759-17533.773-9081.128
2024-25Ohio State Buckeyes397951604945339137-34439.870-20134.853-6384.142
2025-26Ohio State Buckeyes5131275879430064183-40445.385-21040.562-7088.627

More

Chance Gray's college More by season
DD2: Games with double figures in two categories, most often points and rebounds.TD3: Games with double figures in three categories — points, rebounds and assists, usually.TECH: Technical fouls, called for conduct rather than contact: arguing, taunting, hanging on the rim.EJECT: Times the player was thrown out of a game.
2022-23Oregon Ducks001.40.50.9860.42000
2023-24Oregon Ducks001.10.310.42200
2024-25Ohio State Buckeyes001.31.21.1540.5000
2025-26Ohio State Buckeyes001.50.51.270.56100

College seasons as ESPN files them for the school she played for.

More on Chance Gray