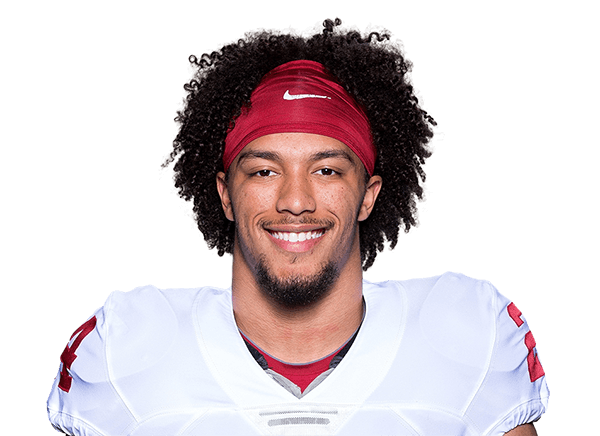
Rodney Anderson stats
Last played for the Oklahoma Sooners, 2018
Compare with…Bio
Rodney Anderson played 3 FBS seasons, 2015 to 2018.
Latest performance

Rodney Anderson
Sep 08 · vs UCLA · W 49-21
- CAR
- 6
- YDS
- 19
- AVG
- 3.2
- TD
- 1
- LNG
- 10
Games
All games| Date | Opponent | TD | CAR | YDS | REC |
|---|---|---|---|---|---|
| Sat, Sep 08 | vs UCLAW 49-21 | 1 | 6 | 19 | — |
| Sat, Sep 01 | vs FAUW 63-14 | 2 | 5 | 100 | — |
| Mon, Jan 01 | vs UGAL 54-48 | 2 | 26 | 201 | 1 |
| Sat, Dec 02 | vs TCUW 41-17 | 0 | 24 | 93 | — |
| Sat, Nov 25 | vs WVUW 59-31 | 4 | 13 | 118 | — |
| Sat, Nov 18 | at KUW 41-3 | 0 | 16 | 77 | 2 |
What were Rodney Anderson's career stats?
Rodney Anderson played 3 seasons for the Sooners. He recorded 2 tackles. His best season was 2017: 1,161 rushing yards, 13 rushing touchdowns and 6.2 yards per carry.
More on Rodney Anderson
Bowl and playoff games
Rodney Anderson played 1 game across 1 FBS postseason — 0 won, 1 lost.
| Season | Opp | Result | CARCAR: Times the player ran with the ball. | YDSYDS: Yards gained through the air, on the ground or after a catch, whichever this table counts. | TDTD: Touchdowns, worth six points before the extra point. |
|---|---|---|---|---|---|
| 2017 | UGA | L 54-48 | 26 | 201 | 2 |
Totals, from FBS game logs since the 2004 postseason — earlier games are not counted.
Rodney Anderson against each club
- vs TCU Horned Frogs (2)
- vs Akron Zips (1)
- vs Florida Atlantic Owls (1)
- vs Georgia Bulldogs (1)
- vs Iowa State Cyclones (1)
- vs Kansas Jayhawks (1)
- vs Kansas State Wildcats (1)
- vs Ohio State Buckeyes (1)
- vs Oklahoma State Cowboys (1)
- vs Texas Longhorns (1)
- vs Texas Tech Red Raiders (1)
- vs Tulane Green Wave (1)
- vs UCLA Bruins (1)
- vs UTEP Miners (1)
- vs West Virginia Mountaineers (1)