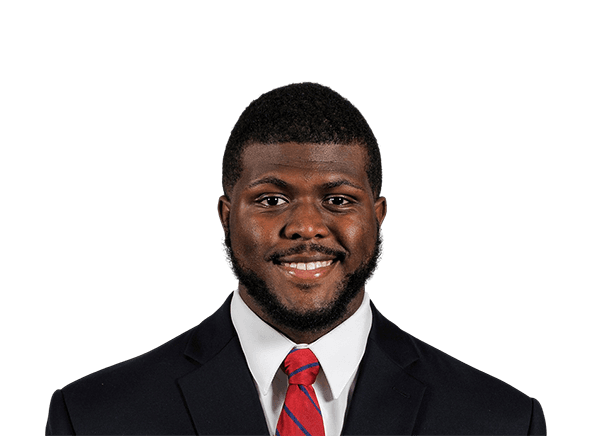
D'Andre Ferby stats
Last played for the Western Kentucky Hilltoppers, 2018
Compare with…Bio
D'Andre Ferby played 4 FBS seasons, 2015 to 2018.
Stats
Totals
Career regular season
- CAR
- 344
- YDS
- 1,297
- AVG
- 3.8
- TD
- 20
- LNG
- 36
Bio
- Birthplace
- Smyrna, TN
- College
- Western Kentucky
Latest performance

D'Andre Ferby
Nov 24 · @ LT · W 30-15
- CAR
- 11
- YDS
- 67
- AVG
- 6.1
- TD
- 2
- LNG
- 36
Games
All games| Date | Opponent | TD | CAR | YDS | REC |
|---|---|---|---|---|---|
| Sat, Nov 24 | at LTW 30-15 | 2 | 11 | 67 | — |
| Sat, Nov 17 | vs UTEPW 40-16 | 2 | 18 | 69 | — |
| Sat, Nov 10 | at FAUL 34-15 | 1 | 6 | 22 | — |
| Fri, Nov 02 | at MTSUL 29-10 | 0 | 3 | 10 | — |
| Sat, Oct 27 | vs FIUL 38-17 | 1 | 2 | 3 | — |
| Sat, Sep 15 | at LOUL 20-17 | 0 | 16 | 74 | 1 |
What were D'Andre Ferby's career stats?
D'Andre Ferby played 4 seasons for the Hilltoppers. His best season was 2015: 650 rushing yards, 11 rushing touchdowns and 4.0 yards per carry.
More on D'Andre Ferby
Bowl and playoff games
D'Andre Ferby played 2 games across 2 FBS postseasons — 1 won, 1 lost.
| CAR: Times the player ran with the ball. | YDS: Yards gained through the air, on the ground or after a catch, whichever this table counts. | TD: Touchdowns, worth six points before the extra point. | |||
|---|---|---|---|---|---|
| 2017 |  GAST | L 27-17 | 5 | 11 | 0 |
| 2015 |  USF | W 45-35 | 13 | 46 | 0 |
Totals, from FBS game logs since the 2004 postseason — earlier games are not counted.
D'Andre Ferby against each club
- vs Florida Atlantic Owls (3)
- vs Florida International Panthers (3)
- vs Middle Tennessee Blue Raiders (3)
- vs Louisiana Tech Bulldogs (2)
- vs Marshall Thundering Herd (2)
- vs Old Dominion Monarchs (2)
- vs Rice Owls (2)
- vs UTEP Miners (2)
- vs Vanderbilt Commodores (2)
- vs Charlotte 49ers (1)
- vs Georgia State Panthers (1)
- vs Illinois Fighting Illini (1)
- vs Indiana Hoosiers (1)
- vs Louisville Cardinals (1)
- vs LSU Tigers (1)
- vs Miami (OH) RedHawks (1)
- vs Southern Miss Golden Eagles (1)
- vs South Florida Bulls (1)
- vs Wisconsin Badgers (1)