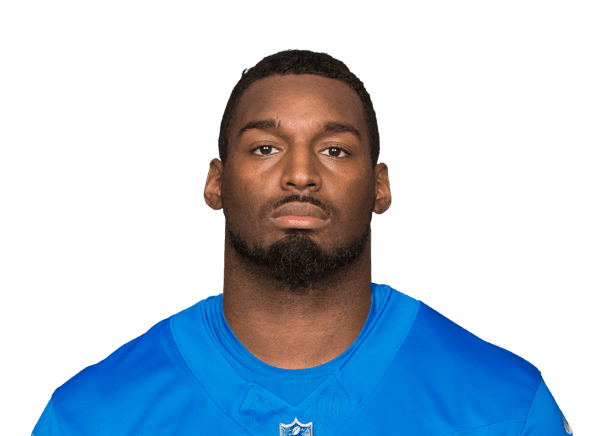
Zach Cunningham 2017 season stats
TexansLinebacker · #52
Compare with…
Zach Cunningham played 16 games for the Houston Texans in the 2017 NFL regular season, with 90 tackles and 1.5 sacks.
2017 season stats
2017 regular season Texans
- GP
- 16
- YDS
- 0
- TD
- 0
- AVG
- 0.0
- FF
- 1
- FR
- 0
- KB
- 0
- PD
- 6
- AST
- 42
- INT
- 0
- LNG
- 0
- STF
- 6
Against other linebackers
2017 regular season, 154 NFL linebackers with 6+ games.
- Sacks1.5
Higher than 56% of the other 153 NFL linebackers.
- Tackles90
Higher than 80% of the other 153 NFL linebackers.
- Forced Fumbles1
Higher than 56% of the other 153 NFL linebackers.
2017 splits
Totals, from the 16 regular-season games in the log.
By opponent
2017 game log
| YDS: Yards gained through the air, on the ground or after a catch, whichever this table counts. | TD: Touchdowns, worth six points before the extra point. | AVG: Yards per attempt: per pass, per carry, per catch or per punt, whichever this table counts. | |||
|---|---|---|---|---|---|
| Dec 31, 2017 |  @ IND | L 22-13 | 0 | 0 | 0.0 |
| Dec 25, 2017 |  vs PIT | L 34-6 | 0 | 0 | 0.0 |
| Dec 17, 2017 |  @ JAX | L 45-7 | 0 | 0 | 0.0 |
| Dec 10, 2017 |  vs SF | L 26-16 | 0 | 0 | 0.0 |
| Dec 3, 2017 |  @ TEN | L 24-13 | 0 | 0 | 0.0 |
| Nov 27, 2017 |  @ BAL | L 23-16 | 0 | 0 | 0.0 |
| Nov 19, 2017 |  vs ARI | W 31-21 | 0 | 0 | 0.0 |
| Nov 12, 2017 |  @ LAR | L 33-7 | 0 | 0 | 0.0 |
| Nov 5, 2017 | vs IND | L 20-14 | 0 | 0 | 0.0 |
| Oct 29, 2017 |  @ SEA | L 41-38 | 0 | 0 | 0.0 |
| Oct 15, 2017 |  vs CLE | W 33-17 | 0 | 0 | 0.0 |
| Oct 8, 2017 |  vs KC | L 42-34 | 0 | 0 | 0.0 |
| Oct 1, 2017 | vs TEN | W 57-14 | 0 | 0 | 0.0 |
| Sep 24, 2017 |  @ NE | L 36-33 | 0 | 0 | 0.0 |
| Sep 14, 2017 |  @ CIN | W 13-9 | 0 | 0 | 0.0 |
All 16 gamesOnly the last 15 games
| YDS: Yards gained through the air, on the ground or after a catch, whichever this table counts. | TD: Touchdowns, worth six points before the extra point. | AVG: Yards per attempt: per pass, per carry, per catch or per punt, whichever this table counts. | |||
|---|---|---|---|---|---|
| Dec 31, 2017 | @ IND | L 22-13 | 0 | 0 | 0.0 |
| Dec 25, 2017 | vs PIT | L 34-6 | 0 | 0 | 0.0 |
| Dec 17, 2017 | @ JAX | L 45-7 | 0 | 0 | 0.0 |
| Dec 10, 2017 | vs SF | L 26-16 | 0 | 0 | 0.0 |
| Dec 3, 2017 | @ TEN | L 24-13 | 0 | 0 | 0.0 |
| Nov 27, 2017 | @ BAL | L 23-16 | 0 | 0 | 0.0 |
| Nov 19, 2017 | vs ARI | W 31-21 | 0 | 0 | 0.0 |
| Nov 12, 2017 | @ LAR | L 33-7 | 0 | 0 | 0.0 |
| Nov 5, 2017 | vs IND | L 20-14 | 0 | 0 | 0.0 |
| Oct 29, 2017 | @ SEA | L 41-38 | 0 | 0 | 0.0 |
| Oct 15, 2017 | vs CLE | W 33-17 | 0 | 0 | 0.0 |
| Oct 8, 2017 | vs KC | L 42-34 | 0 | 0 | 0.0 |
| Oct 1, 2017 | vs TEN | W 57-14 | 0 | 0 | 0.0 |
| Sep 24, 2017 | @ NE | L 36-33 | 0 | 0 | 0.0 |
| Sep 14, 2017 | @ CIN | W 13-9 | 0 | 0 | 0.0 |
| Sep 10, 2017 | vs JAX | L 29-7 | 0 | 0 | 0.0 |
Answered about Zach Cunningham in 2017
Source: ESPN public NFL data, 2017 season.