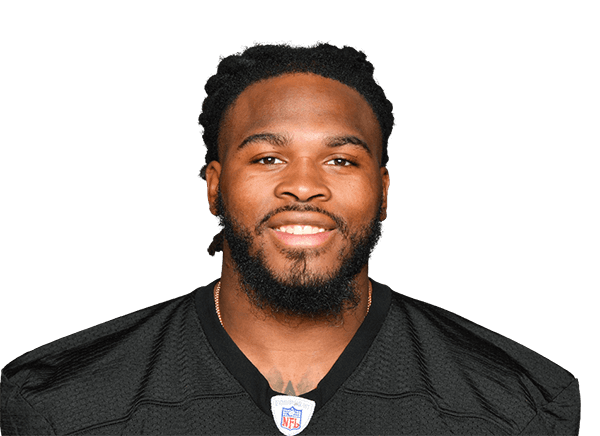
Mark Barron 2012 season stats
BuccaneersLinebacker · #42
Compare with…
Mark Barron played 16 games for the Tampa Bay Buccaneers in the 2012 NFL regular season, with 88 tackles and 0.0 sacks.
2012 season stats
2012 regular season Buccaneers
- GP
- 16
- YDS
- 0
- TD
- 0
- AVG
- 12.0
- FF
- 1
- FR
- 0
- KB
- 0
- PD
- 10
- AST
- 17
- INT
- 1
- LNG
- 12
- STF
- 5
Against other linebackers
2012 regular season, 233 NFL linebackers with 6+ games.
- Tackles88
Higher than 80% of the other 232 NFL linebackers.
- Forced Fumbles1
Higher than 59% of the other 232 NFL linebackers.
- Passes Defended10
Higher than 99% of the other 232 NFL linebackers.
2012 splits
Totals, from the 16 regular-season games in the log.
By opponent
2012 game log
| YDS: Yards gained through the air, on the ground or after a catch, whichever this table counts. | TD: Touchdowns, worth six points before the extra point. | AVG: Yards per attempt: per pass, per carry, per catch or per punt, whichever this table counts. | |||
|---|---|---|---|---|---|
| Dec 30, 2012 |  @ ATL | W 22-17 | 0 | 0 | 0.0 |
| Dec 23, 2012 |  vs LAR | L 28-13 | 0 | 0 | 0.0 |
| Dec 16, 2012 |  @ NO | L 41-0 | 0 | 0 | 0.0 |
| Dec 9, 2012 |  vs PHI | L 23-21 | 0 | 0 | 0.0 |
| Dec 2, 2012 |  @ DEN | L 31-23 | 0 | 0 | 0.0 |
| Nov 25, 2012 | vs ATL | L 24-23 | 0 | 0 | 0.0 |
| Nov 18, 2012 |  @ CAR | W 27-21 OT | 0 | 0 | 0.0 |
| Nov 11, 2012 |  vs LAC | W 34-24 | 0 | 0 | 0.0 |
| Nov 4, 2012 |  @ LV | W 42-32 | 0 | 0 | 0.0 |
| Oct 25, 2012 |  @ MIN | W 36-17 | 0 | 0 | 0.0 |
| Oct 21, 2012 | vs NO | L 35-28 | 0 | 0 | 0.0 |
| Oct 14, 2012 |  vs KC | W 38-10 | 12 | 0 | 12.0 |
| Sep 30, 2012 |  vs WSH | L 24-22 | 0 | 0 | 0.0 |
| Sep 23, 2012 |  @ DAL | L 16-10 | 0 | 0 | 0.0 |
| Sep 16, 2012 |  @ NYG | L 41-34 | 0 | 0 | 0.0 |
All 16 gamesOnly the last 15 games
| YDS: Yards gained through the air, on the ground or after a catch, whichever this table counts. | TD: Touchdowns, worth six points before the extra point. | AVG: Yards per attempt: per pass, per carry, per catch or per punt, whichever this table counts. | |||
|---|---|---|---|---|---|
| Dec 30, 2012 | @ ATL | W 22-17 | 0 | 0 | 0.0 |
| Dec 23, 2012 | vs LAR | L 28-13 | 0 | 0 | 0.0 |
| Dec 16, 2012 | @ NO | L 41-0 | 0 | 0 | 0.0 |
| Dec 9, 2012 | vs PHI | L 23-21 | 0 | 0 | 0.0 |
| Dec 2, 2012 | @ DEN | L 31-23 | 0 | 0 | 0.0 |
| Nov 25, 2012 | vs ATL | L 24-23 | 0 | 0 | 0.0 |
| Nov 18, 2012 | @ CAR | W 27-21 OT | 0 | 0 | 0.0 |
| Nov 11, 2012 | vs LAC | W 34-24 | 0 | 0 | 0.0 |
| Nov 4, 2012 | @ LV | W 42-32 | 0 | 0 | 0.0 |
| Oct 25, 2012 | @ MIN | W 36-17 | 0 | 0 | 0.0 |
| Oct 21, 2012 | vs NO | L 35-28 | 0 | 0 | 0.0 |
| Oct 14, 2012 | vs KC | W 38-10 | 12 | 0 | 12.0 |
| Sep 30, 2012 | vs WSH | L 24-22 | 0 | 0 | 0.0 |
| Sep 23, 2012 | @ DAL | L 16-10 | 0 | 0 | 0.0 |
| Sep 16, 2012 | @ NYG | L 41-34 | 0 | 0 | 0.0 |
| Sep 9, 2012 | vs CAR | W 16-10 | 0 | 0 | 0.0 |
Source: ESPN public NFL data, 2012 season.